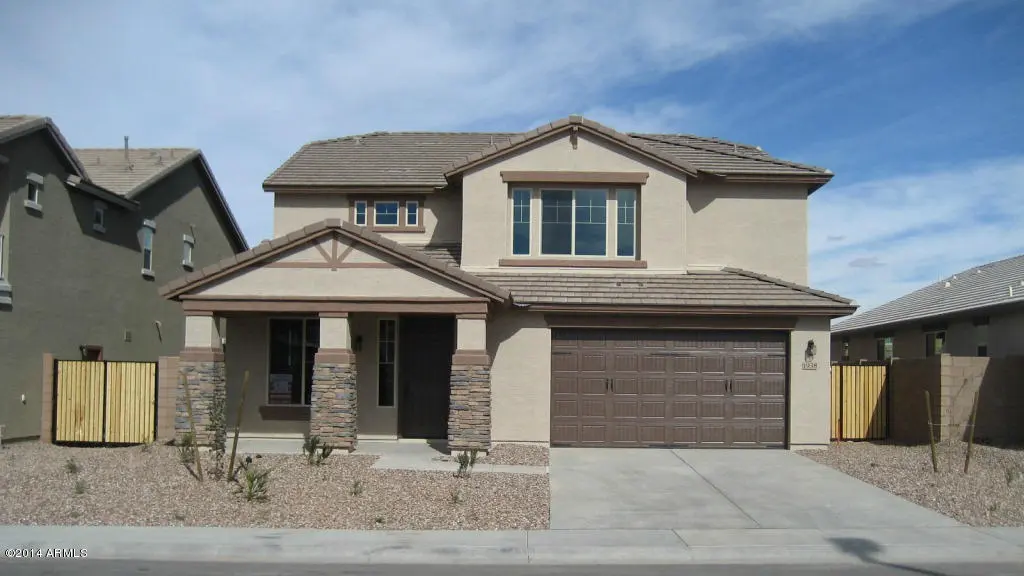
1938 E Hazeltine Way · Gilbert, AZ
Flood risk 1/10 · Minimal
- FEMA flood zone
- X
- Chance of flooding over 30 yrs
- 0.0%
- Est. flood insurance / yr
- $507 – $1,088
Fire risk 6/10 · Moderate
- Est. fire insurance / yr
- $610 – $1,132
Heat risk 9/10 · Severe
- Hot days now (above 112°F)
- 7 days/yr
- Hot days in 30 yrs
- 20 days/yr
Wind risk 1/10 · Minimal
- Chance of severe wind over 30 yrs
- —
Air-quality risk 2/10 · Minimal
- Unhealthy air days now
- 0 days/yr
- Unhealthy air days in 30 yrs
- 1 days/yr
Risk factors via First Street. Map © Google.
Why this score? — see what drove the D grade
The composite is a weighted blend of 9 inputs, each scored 0–100. Each bar is that input's sub-score; the figure is the points it added to the 100-point composite (weight × sub-score).
- ARV discount +9.7/15.0
- Appreciation +9.2/10.0
- Cash flow +6.4/30.0
- Schools +4.8/10.0
- Livability +4.4/5.0
- Rent growth +3.6/5.0
- Condition / age +2.5/5.0
- DSCR +0.7/10.0
- 1% rule +0.6/10.0
$674,800
🖨 Deal sheet 📄 Offer letter ✓ Due diligence
Listing remarks MLS
New Home, complete and ready for move-in. Great 5 bedroom 3 full bath two story home in popular, amenity-rich neighborhood.
Key facts
- Full fitness center
- Scenic walking paths
- 6,325 sq ft lot
Tags
Property features AI
Finance
- Financial info: Current financing: Other
- HOA & community: Homeowners association with monthly fee; Association fee $116 per month; Association maintains grounds; Association rules prohibit visible truck/trailer/RV/boat; Community amenities: pool, lake, heated community spa, community spa, community media room, playground, biking/walking paths, fitness center
Exterior
- Parking: 3 open parking spaces; 3 covered spaces; 3-car garage; Tandem garage configuration; RV gate; Garage door opener; Direct garage access; Separate storage area in garage
- Utilities: City water; Public sewer
- Home design: Single-family residence; Fee simple ownership; Asphalt road access
- Construction: Stucco and painted wood-frame construction; Tile roof
- Exterior features: Front and rear automatic-timer irrigation (sprinklers); Desert front landscaping; Synthetic grass in back; Sprinklers in front and rear; City-maintained road; Block fencing
Interior
- Kitchen: Dishwasher; Disposal; Built-in microwave; Water purifier / reverse osmosis; Non-laminate counters; Walk-in pantry; Kitchen island
- Bedrooms: Up to 6 bedrooms (potential/possible)
- Flooring: Carpet; Tile
- Bathrooms: 3 full bathrooms
- Heating & cooling: Natural gas heating; Ceiling fans; Programmable thermostat; Has heating and cooling
- Interior features: High-speed internet; Double vanity in bath; Upstairs living area; Eat-in kitchen; Breakfast bar; 9+ foot flat ceilings; Kitchen island; Pantry; Full bath in primary suite; Separate shower and tub; Low-emissivity, dual-pane vinyl frame windows
- Laundry & utility: Upstairs laundry; Laundry inside with washer/dryer hookup only
Neighborhood map
What this means for you Summary
Snapshot
- This is a 6-bed/4.0-bath single-family listed at $675k.
Deal economics
- At list price, monthly cash flow is $-1k ($-14k/yr) — negative.
- To cash-flow at today's rent, offer at most $467k (30.8% below list).
- To meet the 1% rule (rent ≥ 1% of price), the offer needs to be $378k (44.0% below list).
- Recommended offer: $378k (44.0% below list) — sets the bar for 1% rule.
- Cap rate 4.2% vs local median 3.2% in Gilbert — top-decile yield for the area; either an underpriced asset or a hidden risk that comps aren't pricing in. Stress-test before assuming the spread holds.
Location & tenants
- Location reads 87/100 on livability (#1 in AZ, #240 nationally) — a professional / high-income tenant draw. Strengths: schools A+, amenities A+, employment A+; Watch: health & safety C-, cost of living F.
- Chandler Unified District #80 (4242) (suburban): math 49% / reading 57% proficiency, ranked #31 of 249 in AZ (top 12%) — acceptable for families but not a draw, mixed tenant base, ~2y average lease.
- Market conditions: Rents rising fast (+4.3%/yr); 329 active listings in the ZIP; 3 comparable units currently listed for rent nearby; rentals at typical pace (median 15d on market — plan ~3-4 weeks tenant-placement turnaround); high-income renter base; 36,011 units permitted in Maricopa County in 2024 (12,801 in 5+ unit buildings).
Forward outlook
- In year one you build about $61k of equity ($5k loan paydown + $56k appreciation (8.4% local appreciation)).
- Maricopa County population projected at +38% by 2050 — long-run rental-demand tailwind backs the buy-and-hold thesis.
- By year 2, paydown + projected appreciation supports a ~$98k cash-out refi (75% LTV) — recoverable capital for the next deal without selling this one.
Negotiation context
- It's been on market 26 days — a 2% lower offer ($665k) is reasonable based on typical stale-listing flexibility.
- 2 sale attempts since 12y ago with the ask held roughly flat each time — persistent listings suggest the price (not the market) is what's stuck; bring a comps-based counter.
- Current owner paid $331k; list at $675k implies a 104% gain — meaningful room to come down on a strong offer.
Risks & watch-outs
- Climate carrying-cost: major wildfire risk; extreme-heat days projected 7→20/yr by 2055 (HVAC capex compounding) — expect insurance premiums to compound above CPI over the hold.
Questions for the listing agent
- What do current leases actually rent for vs. the listed asking? Can we see a recent rent roll and the last 12 months of T-12 income?
- What does the HOA fee cover, when was the last increase, and are there any pending special assessments or reserve-fund shortfalls?
- Is there a deadline driving the sale (1031 exchange, divorce, estate, relocation)? That informs how much negotiation room exists.
- Schools are A-rated — typically a magnet for longer-tenancy family renters. What's the average tenant stay here, and is there a school-zone premium baked into asking?
- The area grade is low — what's the realistic commute time and amenity access for the typical tenant pool here? Any planned neighborhood developments (good or bad) we should know about?
- What's the average days-on-market for RENTAL listings here right now (not sales)? A rising rental-DOM trend means longer vacancies and softer asking-rent achievability than the comps imply.
- What's the recent tenant-quality profile in this submarket — average credit score on applications, eviction rate, late-payment / NSF rate, and stable-employment percentage? A property-management company in the area should have these aggregated.
- How much new for-sale + rental construction is in the pipeline within 1–3 miles? Heavy new supply typically softens prices + rents 12–24 months out; constrained supply supports both.
Investment metrics
- 1% rule
- 0.56% ✗
- Cap rate
- 4.20%
- Cash-on-cash
- -7.48%
- DSCR
- 0.67
- GRM
- 14.9
CMA / ARV
- ARV (on-the-fly)
- $709,671
- Comps found
- 12
Show comp detail 12 sales within ~0.75 mi
| Address | Dist | Beds/Ba | Sqft | Sold | Price | $/sf | Match |
|---|---|---|---|---|---|---|---|
| 7827 S Sequoia Dr | 0.52mi | 5/3.5 (-1) | 2,925 (-6%) | 1mo | $875,000 | $299 | 59 |
| 1961 E Stacey Rd | 0.02mi | 5/3.5 (-1) | 3,541 (+14%) | 13mo | $715,000 | $202 | 57 |
| 6570 S Pewter Way | 0.67mi | 5/3.0 (-1) | 3,140 (+1%) | 9mo | $630,000 | $201 | 50 |
| 2425 E Flintlock Dr | 0.64mi | 5/2.5 (-1) | 2,985 (-4%) | 10mo | $684,900 | $229 | 45 |
| 6627 S Garnet Way | 0.65mi | 5/3.0 (-1) | 2,851 (-8%) | 7mo | $640,000 | $224 | 42 |
| 2199 E Gillcrest Rd | 0.47mi | 5/3.5 (-1) | 3,512 (+13%) | 9mo | $606,000 | $173 | 41 |
| 2247 E Indian Wells Dr | 0.66mi | 5/3.0 (-1) | 2,878 (-7%) | 11mo | $660,000 | $229 | 39 |
| 2215 E LA Costa Dr | 0.66mi | 5/3.0 (-1) | 2,878 (-7%) | 14mo | $705,000 | $245 | 37 |
| 2377 E Galileo Dr | 0.70mi | 5/3.5 (-1) | 3,021 (-2%) | 24mo | $850,000 | $281 | 36 |
| 2459 E Lindrick Dr | 0.67mi | 5/4.0 (-1) | 2,720 (-12%) | 10mo | $740,000 | $272 | 35 |
| 2463 E Stacey Rd | 0.67mi | 5/3.5 (-1) | 3,541 (+14%) | 13mo | $756,500 | $214 | 27 |
| 2378 E Stacey Rd | 0.56mi | 5/3.0 (-1) | 2,651 (-14%) | 23mo | $659,000 | $249 | 22 |
Match score weights: distance 35% · size 25% · config 20% · recency 20%. Top-matched comps best support the ARV.
Projected returns pro-forma
8.36% appreciation · 4.31% rent growth · sell at horizon
- IRR
- 15.5%
- Equity multiple
- 2.18×
- Total profit
- $223,503
- Equity at exit
- $529,414
- IRR
- 15.4%
- Equity multiple
- 4.79×
- Total profit
- $715,694
- Equity at exit
- $1,067,273
Cash invested: $188,944 (down + closing). Projections, not guarantees.
Landlord ↔ Tenant lean methodology
- Overall (STATE)
- 87 Strongly Landlord-Friendly
- State Arizona
- 87 Strongly Landlord-Friendly · R+3
- County
- — inherits STATE
- City
- — inherits STATE
ZIP-level market 85298
- Home prices YoY
- 2.5%
- Rents YoY
- 4.3%
- Active inventory
- 329
- Price-to-rent
- 14.9×
Monthly cashflow live
- Estimated rent
- $3,782 medium interval (Pro) →
- Mortgage (P&I)
- −$3,539
- Tax from tax record
- −$230 /mo · $2,756/yr
- Insurance
- −$281
- HOA
- −$116
- Vacancy / Maint / Mgmt
- −$794
- Net cashflow
- $-1,178
Break-even live
UW: 25.0% down · 7.5% · 30yr · 1.5% tax · 5.0% vac · 8.0% maint · 8.0% mgmt
Financing live
Cash to close
- Down payment
- $168,700
- Closing costs
- $20,244
- Reserves months
- —
- Total cash needed
- —
Loan-product check · same deal, 3 products live
Conventional
25% down · 7.5% · 30yr
- Down + closing
- —
- Monthly P&I
- —
- Monthly cashflow
- —
- DSCR
- —
- Eligible?
- —
Personal DTI + credit; lowest rate.
DSCR
20% down · 8.5% · 30yr
- Down + closing
- —
- Monthly P&I
- —
- Monthly cashflow
- —
- DSCR
- —
- Eligible?
- —
No personal income docs; deal must DSCR.
Hard money
10% down · 12.0% · 12mo
- Down + closing
- —
- Monthly P&I
- —
- Monthly cashflow
- —
- DSCR
- —
- Eligible?
- —
Short-term bridge; refi at stabilization.
Rent comps 3 comps
| Address | Beds | Baths | Sqft | Rent | $/sqft | DOM | Units | Dist |
|---|---|---|---|---|---|---|---|---|
| 7657 S Debra Dr Gilbert, AZ | 5.0 | 3.5 | 3512 | $3,700 | $1.05 | 1d | 1 | 0.54mi |
| 6907 S Emerald Pl Chandler, AZ | 5.0 | 4.0 | 3803 | $2,995 | $0.79 | 17d | 1 | 1.31mi |
| 6907 S Emerald Pl Chandler, AZ | 5.0 | 4.0 | 3803 | $3,295 | $0.87 | 14d | 1 | 1.31mi |
HOA detail
- Monthly dues
- $116 · $1,392/yr
Listing history 19 events
-
2026-06-18days on market $674,800 Active 26 DOM
-
2026-06-17days on market $674,800 Active 25 DOM
-
2026-06-16days on market $674,800 Active 24 DOM
-
2026-06-15days on market $674,800 Active 23 DOM
-
2026-06-13days on market $674,800 Active 21 DOM
-
2026-06-13pricedays on market $674,800 Active 20 DOM
-
2026-06-09days on market $678,000 Active 17 DOM
-
2026-06-08days on market $678,000 Active 16 DOM
-
2026-06-07days on market $678,000 Active 15 DOM
-
2026-06-04pricedays on market $678,000 Active 12 DOM
-
2026-06-03days on market $684,900 Active 11 DOM
-
2026-06-02days on market $684,900 Active 10 DOM
-
2026-06-01days on market $684,900 Active 9 DOM
-
2026-05-31days on market $684,900 Active 8 DOM
-
2026-05-21$684,900 Active
-
2026-05-21historical
-
2014-06-30soldstatus $330,841 Closed 123-char remark
Show marketing remark (123 chars)
New Home, complete and ready for move-in. Great 5 bedroom 3 full bath two story home in popular, amenity-rich neighborhood.
-
2014-04-15status Pending 123-char remark
Show marketing remark (123 chars)
New Home, complete and ready for move-in. Great 5 bedroom 3 full bath two story home in popular, amenity-rich neighborhood.
-
2014-02-12$330,026 Active 123-char remark
Show marketing remark (123 chars)
New Home, complete and ready for move-in. Great 5 bedroom 3 full bath two story home in popular, amenity-rich neighborhood.
ⓘ Source: listings_history table (triggers on properties + properties_extension) + one-shot
backfill from property_details.listing_events for pre-trigger history.
Tax reassessment forecast AZ · Resets to sale price
- Current annual tax
- $2,756 · $230/mo
- Projected year-2 tax
- $4,454 · $371/mo
- Expected delta
- +$1,698/yr (+$141/mo · 61.6%)
ⓘ Screening estimate from a state-policy table — verify with the county assessor before closing.
Climate risk First Street
- Flood 1/10 Low FEMA zone X · 0% chance over 30 yrs
- Wildfire 6/10 Major
- Heat 9/10 Extreme 7 d/yr ≥112°F today · 20 d/yr by 30 yrs out
- Wind 1/10 Low
- Air quality 2/10 Low 0 unhealthy d/yr today · 1 by 30 yrs out
Nearby sold comps map
Loading sold comps map…
Walkable amenities ~0.75 mi
Loading nearby amenities…
Taxation est. · year 1
- Rental income
- $45,382
- − Mortgage interest
- −$37,799
- − Property taxes
- −$2,756
- − Insurance
- −$3,374
- − Repairs & maintenance
- −$3,631
- − Management
- −$3,631
- − HOA
- −$1,392
- − Depreciation
- −$19,631
- Taxable loss
- −$26,831
- Est. tax savings @ 24.0%
- +$6,439
- After-tax cash flow
- $-7,696/yr
For passive investors: Depreciation is non-cash, so a rental often shows a tax loss while cash-flowing — sheltering income. Rental losses are passive: they offset passive income freely, and up to $25,000/yr can offset ordinary (W-2) income if you actively participate and your MAGI is under $100k (phasing out to $0 by $150k); unused losses carry forward. On sale, claimed depreciation is recaptured at up to 25%, and gains may owe capital-gains tax (a 1031 exchange can defer both). Figures are a year-1 estimate at your 24.0% rate — not tax advice; consult a CPA.
Schools (NCES district)
- District
- Chandler Unified District #80 (4242)
- NCES district ID
- 0401870
- Math proficiency
- 49% ▼ -8.00%
- Reading proficiency
- 57% ▼ -2.00%
- Median HH income
- $74,048
- Composite
- 47.54/100
- National rank
- #2268
- State rank
- #31 of 249 in AZ
Livability — Gilbert
- Score
- 87/100
- State rank
- #1
- US rank
- #240
Category grades
Schools grade is shown separately in the Schools card above.
Census & demographics
- Census place
- Gilbert, AZ
- County
- Maricopa County · 4,537,380 people
- City population
- 281,769
- Metro
- Phoenix-Mesa-Chandler, AZ
- Population (ZIP)
- 44,114
- Household income
- $156,425
- Rent vs Own
- Severe rent burden
- 173.0
Population outlook (Maricopa County) Hauer SSP2
- Today (2025)
- 4,979,203 people
- By 2030
- 5,378,229 · +8.0%
- By 2040
- 6,156,598 · +23.6%
- By 2050
- 6,872,376 · +38.0%
- By 2075
- 8,401,270 · +68.7%
- By 2100
- 9,247,439 · +85.7%
Race, ethnicity, and origin ACS 2023
- Neighborhood character
- Predominantly White (72%)
- Race & ethnicity
- White 72% Hispanic / Latino 14% Two or more races 11% Asian 7% Black 2%
- Hispanic origin (detail)
- Mexican 10%
- Common ancestry
- Italian 4% Romanian 3% Lithuanian 3%
- Foreign-born
- 9% · Canada, China, Vietnam
- Languages at home
- 85% English-only · Spanish 7% Other Indo-European 2% Chinese 1%
Political lean MEDSL · Maricopa
- 2024 margin
- Toss-up / Even · D 47.7% · R 51.2% · Other 1.1%
- 2008→2024 swing
- +7.1pp toward D · 2008: -10.6pp · 2024: -3.5pp
- All cycles
- 2024: R+3.5 2020: D+2.2 2016: R+3.5 2012: R+12.0 2008: R+10.6
Not yet ingested
- Civics
- —
Market trends
- HPI YoY
- ▲ 8.36%
- Current HPI
- 343.6932
- Rent YoY
- ▲ 4.31%
- Metro
- Phoenix-Mesa-Chandler, AZ
- State GDP YoY
- ▲ 4.54%
- F500 in state
- 20
Industry mix (Fortune 500 HQ in AZ)
| Industry | F500 HQs | Revenue |
|---|---|---|
| Technology | 2 | $13B |
|
||
| Mining / Metals | 1 | $23B |
|
||
| Environmental Services | 1 | $16B |
|
||
| Metals / Steel | 1 | $14B |
|
||
| Technology Distribution | 1 | $9B |
|
||
| Homebuilding | 1 | $8B |
|
||
Price history
+107.5% since first listed5 events — show timeline
- 2026-05-21 Listing Removed — ARMLS
- 2026-05-21 Listed $684,900 ARMLS
- 2014-06-30 Sold (MLS) $330,841 ARMLS
- 2014-04-15 Pending — ARMLS
- 2014-02-12 Listed $330,026 ARMLS
Property tax history
+34.4%/yrLatest (2025): $2,756 · +1.2% YoY. Source: county tax records.
Cash-flow waterfall
monthlySold comps — $/sqft
last 12 mo · ≤1 miLoading sold comps…