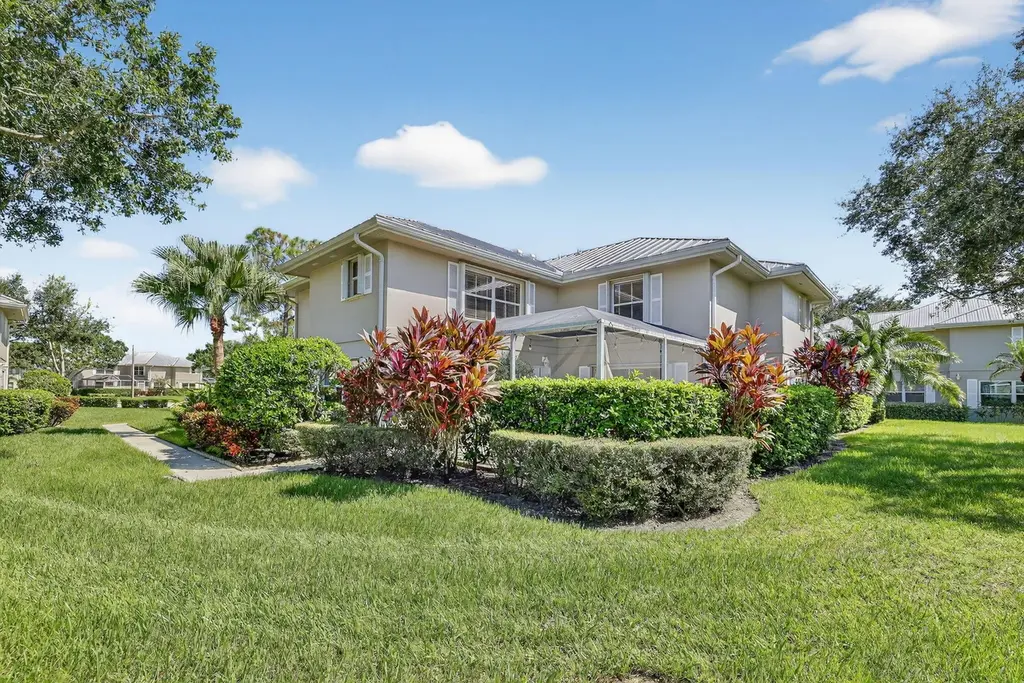
2433 SW Danbury Ln
Palm City, FL 34990
$225,000C-
2 bd · 2.5 ba ·
1,374 sqft ·
Built 1989
· Townhouse
· Active
· 2 DOM
Cashflow @ list (25.0% down · 7.5%)
Estimated rent
$2,518/mo
Mortgage (P&I)
−$1,180
Tax + insurance
−$362
HOA
−$449
Vac / Maint / Mgmt
−$529
Net cashflow
$-2/mo
Annual
$-21/yr
Cap rate
6.28%
Cash-on-cash
-0.03%
DSCR
1.00
1% rule
1.12%
Cash to close
$63,000
Investor read
- This is a 2-bed/2.5-bath townhouse listed at $225k.
- At list price, monthly cash flow is $-2 ($-21/yr) — negative.
- To cash-flow at today's rent, offer at most $225k (0.1% below list).
- Meets the 1% rule at list price ($3k rent vs $225k).
- Only 2 days on market — expect competitive offers; lowballing is unlikely to land.
- Recommended offer: $225k (0.1% below list) — sets the bar for cash-flow.
- Local home prices are declining (-3.0%/yr); year-one equity from $2k of loan paydown is wiped out by about $7k of value loss. Plan a longer hold.
- Location reads 79/100 on livability (#140 in FL, #2,113 nationally) — a middle-class / working-renter tenant base. Strengths: schools A+, crime A+, employment A+; Watch: amenities F, commute F, cost of living F.
- Martin (suburban): math 52% / reading 53% proficiency, ranked #24 of 73 in FL (top 33%) — acceptable for families but not a draw, mixed tenant base, ~2y average lease.
- Market conditions: Rents soft (-0.1%/yr); 446 active listings in the ZIP; 16 comparable units currently listed for rent nearby; rentals at typical pace (median 24d on market — plan ~3-4 weeks tenant-placement turnaround); high-income renter base; 737 units permitted in Martin County in 2024 (167 in 5+ unit buildings).
- Martin County population projected at +19% by 2050 — long-run rental-demand tailwind backs the buy-and-hold thesis.
- 5 sale attempts since 22y ago; this cycle's ask has dropped $60k (21%) from the opening price — seller is motivated, your offer sets the floor, not the list.
- Climate carrying-cost: severe wind risk, 99% chance of damaging wind over 30y; extreme-heat days projected 5→16/yr by 2055 (HVAC capex compounding) — expect insurance premiums to compound above CPI over the hold.
- Cap rate 6.3% vs local median 2.6% in Palm City — top-decile yield for the area; either an underpriced asset or a hidden risk that comps aren't pricing in. Stress-test before assuming the spread holds.
Questions for listing agent
- What do current leases actually rent for vs. the listed asking? Can we see a recent rent roll and the last 12 months of T-12 income?
- What does the HOA fee cover, when was the last increase, and are there any pending special assessments or reserve-fund shortfalls?
- Is there a deadline driving the sale (1031 exchange, divorce, estate, relocation)? That informs how much negotiation room exists.
- Schools are A-rated — typically a magnet for longer-tenancy family renters. What's the average tenant stay here, and is there a school-zone premium baked into asking?
- What's the average days-on-market for RENTAL listings here right now (not sales)? A rising rental-DOM trend means longer vacancies and softer asking-rent achievability than the comps imply.
- What's the recent tenant-quality profile in this submarket — average credit score on applications, eviction rate, late-payment / NSF rate, and stable-employment percentage? A property-management company in the area should have these aggregated.
- How much new for-sale + rental construction is in the pipeline within 1–3 miles? Heavy new supply typically softens prices + rents 12–24 months out; constrained supply supports both.
CashFlowRE · CFR-2SFFZ73V006101
· Data 2 days ago
cashflowre.app · 2026-05-29