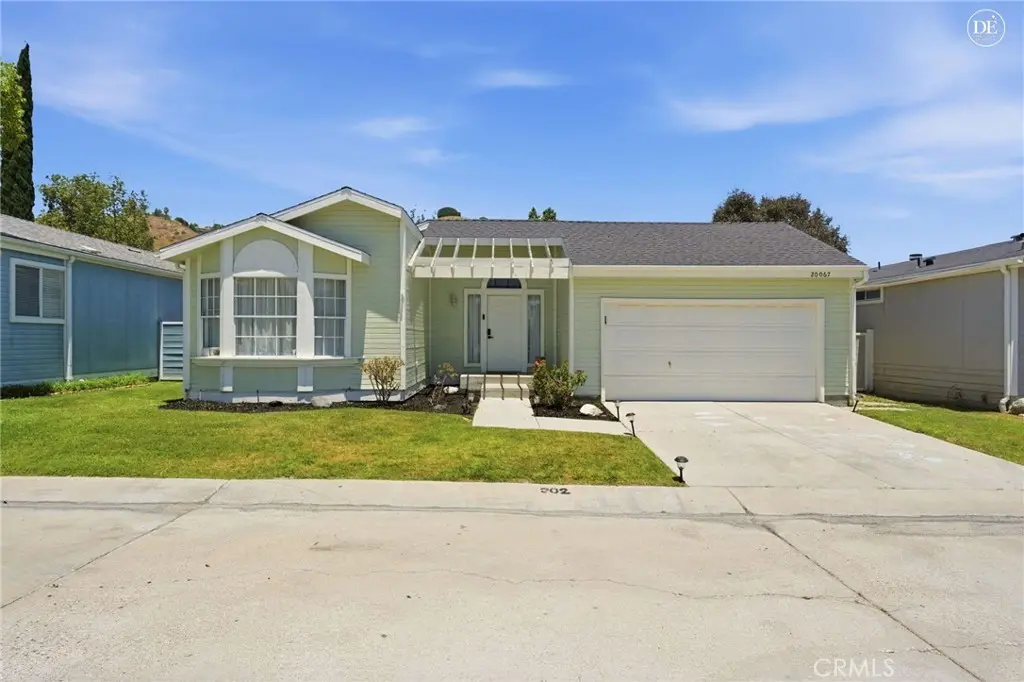
20067 Canyon View Dr
Santa Clarita, CA 91351
$320,000B-
3 bd · 2.0 ba ·
1,845 sqft ·
Built 1991
· Manufactured
· Active
· 13 DOM
Cashflow @ list (25.0% down · 7.5%)
Estimated rent
$4,579/mo
Mortgage (P&I)
−$1,678
Tax + insurance
−$363
HOA
−$0
Vac / Maint / Mgmt
−$962
Net cashflow
$1,576/mo
Annual
$18,911/yr
Cap rate
12.20%
Cash-on-cash
21.11%
DSCR
1.94
1% rule
1.43%
Cash to close
$89,600
Investor read
- This is a 3-bed/2.0-bath manufactured listed at $320k.
- At list price, monthly cash flow is $2k ($19k/yr) — positive.
- The deal already cash-flows at list — no discount required.
- Meets the 1% rule at list price ($5k rent vs $320k).
- Only 13 days on market — expect competitive offers; lowballing is unlikely to land.
- Local home prices are declining (-3.0%/yr); year-one equity from $2k of loan paydown is wiped out by about $10k of value loss. Plan a longer hold.
- Location reads 70/100 on livability (#229 in CA) — a middle-class / working-renter tenant base. Strengths: employment A+, housing A, crime A-; Watch: amenities D+, cost of living F, health & safety F.
- William S. Hart Union High (suburban): math 52% / reading 72% proficiency, ranked #155 of 1,400 in CA (top 11%) — acceptable for families but not a draw, mixed tenant base, ~2y average lease; only 18% free/reduced lunch — higher-income household profile.
- Zoned schools: Sierra Vista Junior High (991 students, 35% FRL); Canyon High (1,946 students, 37% FRL) — zoned schools average 36% FRL vs 18% district-wide (17 pts higher); higher-poverty schools than district average — tighter screening recommended.
- Market conditions: Rents rising (+1.7%/yr); 106 active listings in the ZIP; 17 comparable units currently listed for rent nearby; rentals leasing fast (median 1d on market — plan ~1-2 weeks tenant-placement turnaround); high-income renter base; 19,697 units permitted in Los Angeles County in 2024 (9,426 in 5+ unit buildings).
- Los Angeles County population projected at +9% by 2050 — modest demand growth; plan on rents tracking national, not racing it.
- 3 sale attempts since 8y ago with the ask held roughly flat each time — persistent listings suggest the price (not the market) is what's stuck; bring a comps-based counter.
- Current owner paid $135k; list at $320k implies a 137% gain — meaningful room to come down on a strong offer.
- At projected returns (-3.0% appreciation + 1.7% rent growth), your $90k cash investment doubles in ~7 years — after that, you're playing with house money.
- Climate carrying-cost: severe wildfire risk; extreme-heat days projected 7→19/yr by 2055 (HVAC capex compounding) — expect insurance premiums to compound above CPI over the hold.
- Cap rate 12.2% vs local median 2.8% in Santa Clarita — top-decile yield for the area; either an underpriced asset or a hidden risk that comps aren't pricing in. Stress-test before assuming the spread holds.
- At $4,579/mo this rent would consume 48% of the median local household income ($115k/yr) (locally 784% of renters already pay >50% of income on rent) — very limited rent-growth headroom before tenants either downsize or default.
Questions for listing agent
- Is there a deadline driving the sale (1031 exchange, divorce, estate, relocation)? That informs how much negotiation room exists.
- Schools are B-rated — typically a magnet for longer-tenancy family renters. What's the average tenant stay here, and is there a school-zone premium baked into asking?
- What's the average days-on-market for RENTAL listings here right now (not sales)? A rising rental-DOM trend means longer vacancies and softer asking-rent achievability than the comps imply.
- What's the recent tenant-quality profile in this submarket — average credit score on applications, eviction rate, late-payment / NSF rate, and stable-employment percentage? A property-management company in the area should have these aggregated.
- How much new for-sale + rental construction is in the pipeline within 1–3 miles? Heavy new supply typically softens prices + rents 12–24 months out; constrained supply supports both.
CashFlowRE · CFR-2T3PZREC43M2C3
· Data 2 days ago
cashflowre.app · 2026-05-29