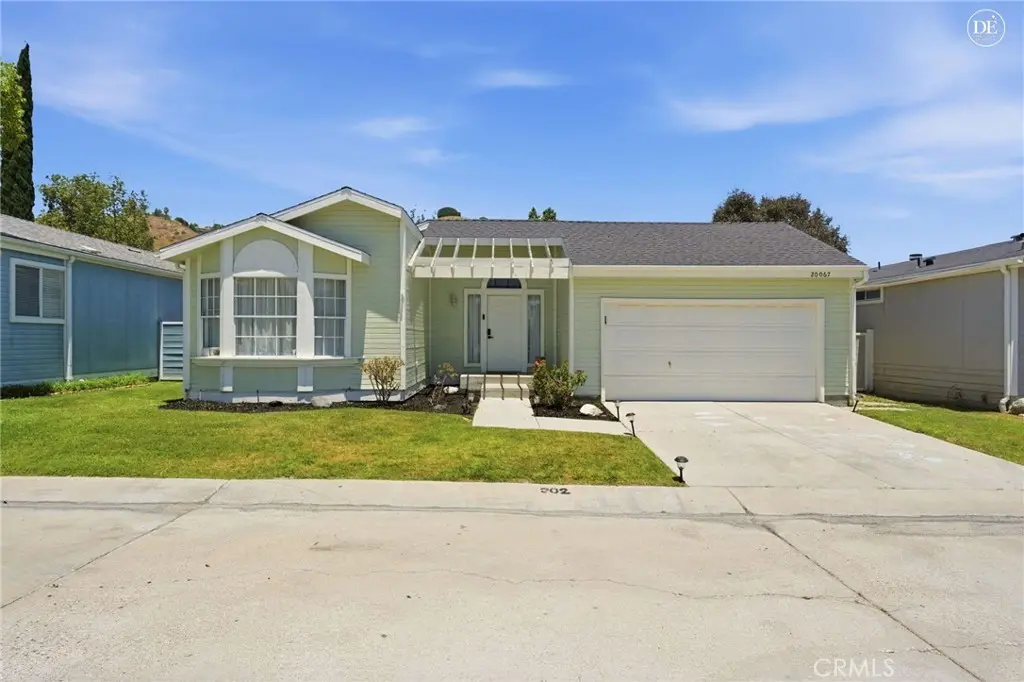
20067 Canyon View Dr · Santa Clarita, CA
Flood risk 1/10 · Minimal
- FEMA flood zone
- X (unshaded)
- Chance of flooding over 30 yrs
- 0.0%
- Est. flood insurance / yr
- $507 – $1,088
Fire risk 8/10 · Major
- Est. fire insurance / yr
- $659 – $1,223
Heat risk 7/10 · Major
- Hot days now (above 99°F)
- 7 days/yr
- Hot days in 30 yrs
- 19 days/yr
Wind risk 1/10 · Minimal
- Chance of severe wind over 30 yrs
- —
Air-quality risk 6/10 · Moderate
- Unhealthy air days now
- 9 days/yr
- Unhealthy air days in 30 yrs
- 13 days/yr
Risk factors via First Street. Map © Google.
Why this score? — see what drove the B- grade
The composite is a weighted blend of 9 inputs, each scored 0–100. Each bar is that input's sub-score; the figure is the points it added to the 100-point composite (weight × sub-score).
- Cash flow +30.0/30.0
- DSCR +10.0/10.0
- 1% rule +9.3/10.0
- Schools +5.9/10.0
- ARV discount +4.3/15.0
- Livability +3.5/5.0
- Rent growth +2.9/5.0
- Condition / age +2.5/5.0
- Appreciation +0.0/10.0
$320,000
🖨 Deal sheet 📄 Offer letter ✓ Due diligence
Listing remarks MLS
Welcome to Canyon View Estates! This beautifully updated 3 bedroom, 2 bath home offers approximately 1,825 square feet in one of the community’s largest floor plans. Vaulted ceilings, abundant natural light, updated flooring, and a spacious layout featuring both a living room and separate family room create an inviting atmosphere throughout. The remodeled kitchen showcases white cabinetry, stainless steel appliances and ample counter space, while the stunning primary suite offers a spa like bath with a freestanding soaking tub and oversized walk in shower. Outside, enjoy a private backyard retreat complete with artificial turf, mature trees, decorative lighting and an elevated entertaining deck. Located within the gated Canyon View Estates community, residents enjoy access to pools, playgrounds, sports courts, a recreation hall, RV parking (subject to availability) and nearby Discovery Park. Canyon View Estates is a leased land community where residents own the home and lease the land. A rare opportunity to own one of the community’s most desirable and updated homes!
Key facts
- Access to pools
- Remodeled kitchen
- 3,700 sq ft lot
Tags
Property features AI
Finance
- Other: Lot size source from assessor's data; Living area source from assessor's data
- HOA & community: Land lease (current amount specified separately); Community features include street lighting; Park name: Canyon View Estates; Manager approval required
Exterior
- Parking: Attached garage; Garage with 2 parking spaces
- Security: Gated community; Carbon monoxide detector(s); Smoke detector
- Utilities: Public sewer; District/public water; Natural gas connected; Electricity connected; Sewer connected; Water connected
- Home design: Single-story home; Front entry
- Construction: Mobile home remains on site; Year built from assessor
- Exterior features: Wood fencing; Landscaped yard with front and back yard and lawn; Association pool; Has view
Interior
- Kitchen: Remodeled kitchen; Microwave; Gas oven; Dishwasher; Water heater unit
- Bedrooms: All bedrooms on main level
- Flooring: Vinyl flooring
- Bathrooms: Two full bathrooms; Remodeled bathrooms; Soaking tub; Walk-in shower; Shower in tub
- Heating & cooling: Central cooling
- Interior features: Laminate counters; Built-in storage; Gated community; Association spa; Carbon monoxide detector(s); Smoke detector
- Laundry & utility: Inside laundry in a dedicated room
Neighborhood map
What this means for you Summary
Snapshot
- This is a 3-bed/2.0-bath manufactured listed at $320k.
Deal economics
- At list price, monthly cash flow is $2k ($19k/yr) — positive.
- The deal already cash-flows at list — no discount required.
- Meets the 1% rule at list price ($5k rent vs $320k).
- Cap rate 12.2% vs local median 2.8% in Santa Clarita — top-decile yield for the area; either an underpriced asset or a hidden risk that comps aren't pricing in. Stress-test before assuming the spread holds.
Location & tenants
- Location reads 70/100 on livability (#229 in CA) — a middle-class / working-renter tenant base. Strengths: employment A+, housing A, crime A-; Watch: amenities D+, cost of living F, health & safety F.
- William S. Hart Union High (suburban): math 52% / reading 72% proficiency, ranked #155 of 1,400 in CA (top 11%) — acceptable for families but not a draw, mixed tenant base, ~2y average lease; only 18% free/reduced lunch — higher-income household profile.
- Zoned schools: Sierra Vista Junior High (991 students, 35% FRL); Canyon High (1,946 students, 37% FRL) — zoned schools average 36% FRL vs 18% district-wide (17 pts higher); higher-poverty schools than district average — tighter screening recommended.
- Market conditions: Rents rising (+1.7%/yr); 106 active listings in the ZIP; 17 comparable units currently listed for rent nearby; rentals leasing fast (median 1d on market — plan ~1-2 weeks tenant-placement turnaround); high-income renter base; 19,697 units permitted in Los Angeles County in 2024 (9,426 in 5+ unit buildings).
- At $4,579/mo this rent would consume 48% of the median local household income ($115k/yr) (locally 784% of renters already pay >50% of income on rent) — very limited rent-growth headroom before tenants either downsize or default.
Forward outlook
- Local home prices are declining (-3.0%/yr); year-one equity from $2k of loan paydown is wiped out by about $10k of value loss. Plan a longer hold.
- Los Angeles County population projected at +9% by 2050 — modest demand growth; plan on rents tracking national, not racing it.
- At projected returns (-3.0% appreciation + 1.7% rent growth), your $90k cash investment doubles in ~7 years — after that, you're playing with house money.
Negotiation context
- Only 13 days on market — expect competitive offers; lowballing is unlikely to land.
- 3 sale attempts since 8y ago with the ask held roughly flat each time — persistent listings suggest the price (not the market) is what's stuck; bring a comps-based counter.
- Current owner paid $135k; list at $320k implies a 137% gain — meaningful room to come down on a strong offer.
Risks & watch-outs
- Climate carrying-cost: severe wildfire risk; extreme-heat days projected 7→19/yr by 2055 (HVAC capex compounding) — expect insurance premiums to compound above CPI over the hold.
Questions for the listing agent
- Is there a deadline driving the sale (1031 exchange, divorce, estate, relocation)? That informs how much negotiation room exists.
- Schools are B-rated — typically a magnet for longer-tenancy family renters. What's the average tenant stay here, and is there a school-zone premium baked into asking?
- What's the average days-on-market for RENTAL listings here right now (not sales)? A rising rental-DOM trend means longer vacancies and softer asking-rent achievability than the comps imply.
- What's the recent tenant-quality profile in this submarket — average credit score on applications, eviction rate, late-payment / NSF rate, and stable-employment percentage? A property-management company in the area should have these aggregated.
- How much new for-sale + rental construction is in the pipeline within 1–3 miles? Heavy new supply typically softens prices + rents 12–24 months out; constrained supply supports both.
Investment metrics
- 1% rule
- 1.43% ✓
- Cap rate
- 12.20%
- Cash-on-cash
- 21.11%
- DSCR
- 1.94
- GRM
- 5.8
CMA / ARV
- ARV (on-the-fly)
- $298,890
- Comps found
- 7
Show comp detail 7 sales within ~0.75 mi
| Address | Dist | Beds/Ba | Sqft | Sold | Price | $/sf | Match |
|---|---|---|---|---|---|---|---|
| 20126 Northcliff | 0.12mi | 3/2.0 | 1,752 (-5%) | 2mo | $280,000 | $160 | 85 |
| 20039 Emerald Creek Dr | 0.15mi | 3/2.0 | 1,845 (0%) | 16mo | $300,000 | $163 | 80 |
| 19983 Crestview Dr | 0.15mi | 3/2.0 | 1,752 (-5%) | 7mo | $360,000 | $205 | 79 |
| 27829 Sunrise Ln | 0.24mi | 3/2.0 | 1,752 (-5%) | 3mo | $283,000 | $162 | 78 |
| 19954 Emerald Crk | 0.21mi | 3/2.0 | 1,845 (0%) | 19mo | $335,000 | $182 | 74 |
| 20401 Soledad Cyn #613 | 0.53mi | 3/2.0 | 1,824 (-1%) | 24mo | $254,500 | $140 | 54 |
| 20401 Soledad Canyon Rd #231 | 0.53mi | 3/2.0 | 1,568 (-15%) | 3mo | $240,000 | $153 | 48 |
Match score weights: distance 35% · size 25% · config 20% · recency 20%. Top-matched comps best support the ARV.
Projected returns pro-forma
-3.0% appreciation · 1.7% rent growth · sell at horizon
- IRR
- 12.1%
- Equity multiple
- 1.48×
- Total profit
- $42,571
- Equity at exit
- $47,713
- IRR
- 20.1%
- Equity multiple
- 2.59×
- Total profit
- $142,536
- Equity at exit
- $27,668
Cash invested: $89,600 (down + closing). Projections, not guarantees.
Landlord ↔ Tenant lean methodology
- Overall (STATE)
- 18 Strongly Tenant-Friendly
- State California
- 18 Strongly Tenant-Friendly · D+13
- County
- — inherits STATE
- City
- — inherits STATE
ZIP-level market 91351
- Rents YoY
- 1.7%
- Active inventory
- 106
- Price-to-rent
- 5.8×
Monthly cashflow live
- Estimated rent
- $4,579 high interval (Pro) →
- Mortgage (P&I)
- −$1,678
- Tax from tax record
- −$230 /mo · $2,762/yr
- Insurance
- −$133
- HOA
- −$0
- Vacancy / Maint / Mgmt
- −$962
- Net cashflow
- $1,576
Break-even live
UW: 25.0% down · 7.5% · 30yr · 1.5% tax · 5.0% vac · 8.0% maint · 8.0% mgmt
Financing live
Cash to close
- Down payment
- $80,000
- Closing costs
- $9,600
- Reserves months
- —
- Total cash needed
- —
Loan-product check · same deal, 3 products live
Conventional
25% down · 7.5% · 30yr
- Down + closing
- —
- Monthly P&I
- —
- Monthly cashflow
- —
- DSCR
- —
- Eligible?
- —
Personal DTI + credit; lowest rate.
DSCR
20% down · 8.5% · 30yr
- Down + closing
- —
- Monthly P&I
- —
- Monthly cashflow
- —
- DSCR
- —
- Eligible?
- —
No personal income docs; deal must DSCR.
Hard money
10% down · 12.0% · 12mo
- Down + closing
- —
- Monthly P&I
- —
- Monthly cashflow
- —
- DSCR
- —
- Eligible?
- —
Short-term bridge; refi at stabilization.
Rent comps 17 comps
| Address | Beds | Baths | Sqft | Rent | $/sqft | DOM | Units | Dist |
|---|---|---|---|---|---|---|---|---|
| 27932 Calypso Ln Canyon Country, CA | 4.0 | 2.0 | 1789 | $7,495 | $4.19 | 1d | 1 | 0.63mi |
| 27932 Calypso Ln Canyon Country, CA | 4.0 | 2.0 | 1783 | $7,495 | $4.20 | 19d | 1 | 0.63mi |
| 28040 Ermine Pl Canyon Country, CA | 4.0 | 2.0 | 1467 | $4,250 | $2.90 | 1d | 1 | 0.67mi |
| 28131 Florence Ln Canyon Country, CA | 3.0 | 2.0 | 1515 | $4,300 | $2.84 | 1d | 1 | 0.83mi |
| 26844 Albion Way Unit 1 Santa Clarita, CA | 3.0 | 2.5 | 1817 | $3,995 | $2.20 | 12d | 1 | 0.90mi |
| 28128 Wildwind Rd Canyon Country, CA | 3.0 | 3.0 | 1900 | $3,875 | $2.04 | 1d | 1 | 0.94mi |
| 20000 Plum Canyon Rd Santa Clarita, CA | 1.0–3.0 | 1.0–3.0 | 1051 | $3,700 | $3.52 | 24d | 2 | 1.23mi |
| 20000 Plum Canyon Rd Santa Clarita, CA | 3.0 | 3.0 | 1370 | $3,700 | $2.70 | 1d | 1 | 1.23mi |
| 19335 Laroda Ln Santa Clarita, CA | 2.0 | 2.0 | 1400 | $3,000 | $2.14 | 7d | 1 | 1.27mi |
| 28371 Mirabelle Ln Santa Clarita, CA | 3.0 | 2.5 | 1710 | $3,400 | $1.99 | 6d | 1 | 1.28mi |
| 22056 Windham Way Santa Clarita, CA | 4.0 | 3.0 | 2132 | $4,350 | $2.04 | 1d | 1 | 1.28mi |
| 28136 Bakerton Ave Canyon Country, CA | 3.0 | 2.0 | 1400 | $3,800 | $2.71 | 7d | 1 | 1.30mi |
| 28366 Casselman Ln Santa Clarita, CA | 3.0 | 2.5 | 1710 | $3,650 | $2.13 | 1d | 1 | 1.31mi |
| 28519 Moyer Ln Santa Clarita, CA | 4.0 | 3.0 | 2360 | $4,950 | $2.10 | 1d | 1 | 1.33mi |
| 18735 Bookham Dr Canyon Country, CA | 4.0 | 2.0 | 1628 | $4,900 | $3.01 | 16d | 1 | 1.35mi |
| 19341 Opal Ln Santa Clarita, CA | 3.0 | 3.0 | 1850 | $3,850 | $2.08 | 18d | 1 | 1.36mi |
| 19300 Maybrook LN Santa Clarita, CA | 1.0–3.0 | 1.0–2.0 | 1017 | $3,744 | $3.68 | 1d | 61 | 1.45mi |
Listing history 12 events
-
2026-06-18$320,000 Active 13 DOM
-
2026-06-18days on market $320,000 Active 13 DOM
-
2026-06-17$320,000 Active 12 DOM
-
2026-06-17days on market $320,000 Active 12 DOM
-
2026-06-16days on market $320,000 Active 11 DOM
-
2026-06-15days on market $320,000 Active 10 DOM
-
2026-06-13days on market $320,000 Active 8 DOM
-
2026-06-13days on market $320,000 Active 7 DOM
-
2026-06-09days on market $320,000 Active 4 DOM
-
2026-06-08days on market $320,000 Active 3 DOM
-
2026-06-07remarks 693-char remark
-
2026-06-07$320,000 Active 2 DOM
ⓘ Source: listings_history table (triggers on properties + properties_extension) + one-shot
backfill from property_details.listing_events for pre-trigger history.
Tax reassessment forecast CA · Resets to sale price
- Current annual tax
- $2,762 · $230/mo
- Projected year-2 tax
- $2,762 · $230/mo
- Expected delta
- $0/yr ($0/mo · 0.0%)
ⓘ Screening estimate from a state-policy table — verify with the county assessor before closing.
Climate risk First Street
- Flood 1/10 Low FEMA zone X (unshaded) · 0% chance over 30 yrs
- Wildfire 8/10 Severe
- Heat 7/10 Severe 7 d/yr ≥99°F today · 19 d/yr by 30 yrs out
- Wind 1/10 Low
- Air quality 6/10 Major 9 unhealthy d/yr today · 13 by 30 yrs out
Nearby sold comps map
Loading sold comps map…
Walkable amenities ~0.75 mi
Loading nearby amenities…
Taxation est. · year 1
- Rental income
- $54,950
- − Mortgage interest
- −$17,925
- − Property taxes
- −$2,762
- − Insurance
- −$1,600
- − Repairs & maintenance
- −$4,396
- − Management
- −$4,396
- − Depreciation
- −$9,309
- Taxable income
- $14,562
- Est. tax owed @ 24.0%
- −$3,495
- After-tax cash flow
- $15,417/yr
For passive investors: Depreciation is non-cash, so a rental often shows a tax loss while cash-flowing — sheltering income. Rental losses are passive: they offset passive income freely, and up to $25,000/yr can offset ordinary (W-2) income if you actively participate and your MAGI is under $100k (phasing out to $0 by $150k); unused losses carry forward. On sale, claimed depreciation is recaptured at up to 25%, and gains may owe capital-gains tax (a 1031 exchange can defer both). Figures are a year-1 estimate at your 24.0% rate — not tax advice; consult a CPA.
Schools (NCES district)
- District
- William S. Hart Union High
- NCES district ID
- 0642510
- Math proficiency
- 52% ▬ 0.00%
- Reading proficiency
- 72% ▲ 1.00%
- Median HH income
- $95,844
- Composite
- 58.6/100
- National rank
- #2030
- State rank
- #155 of 1400 in CA
Livability — Santa Clarita
- Score
- 70/100
- State rank
- #229
- US rank
- #7378
Category grades
Schools grade is shown separately in the Schools card above.
Census & demographics
- Census place
- Santa Clarita, CA
- County
- Los Angeles County · 9,444,647 people
- City population
- 219,066
- Metro
- Los Angeles-Long Beach-Anaheim, CA
- Population (ZIP)
- 33,155
- Household income
- $115,364
- Rent vs Own
- Severe rent burden
- 784.0
Population outlook (Los Angeles County) Hauer SSP2
- Today (2025)
- 10,940,515 people
- By 2030
- 11,256,481 · +2.9%
- By 2040
- 11,729,929 · +7.2%
- By 2050
- 11,948,407 · +9.2%
- By 2075
- 11,818,114 · +8.0%
- By 2100
- 10,842,928 · -0.9%
Race, ethnicity, and origin ACS 2023
- Neighborhood character
- Diverse neighborhood (Simpson 0.64)
- Race & ethnicity
- Hispanic / Latino 49% White 34% Two or more races 21% Asian 6% Black 4% Native American 1%
- Hispanic origin (detail)
- Mexican 36%
- Common ancestry
- Romanian 1% Lithuanian 1% Scotch-Irish 1%
- Foreign-born
- 23% · Canada, Jamaica, South Korea
- Languages at home
- 54% English-only · Spanish 35% Other Indo-European 3% Tagalog/Filipino 2%
Political lean MEDSL · Los Angeles
- 2024 margin
- Solid D (+32.9) · D 64.8% · R 31.9% · Other 3.3%
- 2008→2024 swing
- -7.4pp toward R · 2008: 40.4pp · 2024: 32.9pp
- All cycles
- 2024: D+32.9 2020: D+44.2 2016: D+48.0 2012: D+40.0 2008: D+40.4
Not yet ingested
- Civics
- —
Market trends
- HPI YoY
- ▼ -703.16%
- Current HPI
- 360.9901
- Rent YoY
- ▲ 1.70%
- Metro
- Los Angeles-Long Beach-Anaheim, CA
- State GDP YoY
- ▲ 3.21%
- F500 in state
- 116
Industry mix (Fortune 500 HQ in CA)
| Industry | F500 HQs | Revenue |
|---|---|---|
| Technology | 27 | $1,492B |
|
||
| Financial Services | 3 | $174B |
|
||
| Retail | 3 | $44B |
|
||
| Insurance | 3 | $26B |
|
||
| Media / Entertainment | 2 | $115B |
|
||
| Pharmaceuticals / Biotech | 2 | $62B |
|
||
Price history
+91.6% since first listed8 events — show timeline
- 2026-06-05 Listed $320,000 CRMLS
- 2026-06-05 Listed $320,000 CRMLS
- 2019-04-04 Sold (MLS) $135,000 CRMLS
- 2019-03-12 Pending — CRMLS
- 2019-02-22 Price Changed $149,000 CRMLS
- 2019-02-12 Price Changed $154,000 CRMLS
- 2019-01-24 Price Changed $159,000 CRMLS
- 2018-11-09 Listed $167,000 CRMLS
Property tax history
+7.6%/yrLatest (2025): $2,762 · +7.6% YoY. Source: county tax records.
Cash-flow waterfall
monthlySold comps — $/sqft
last 12 mo · ≤1 miLoading sold comps…