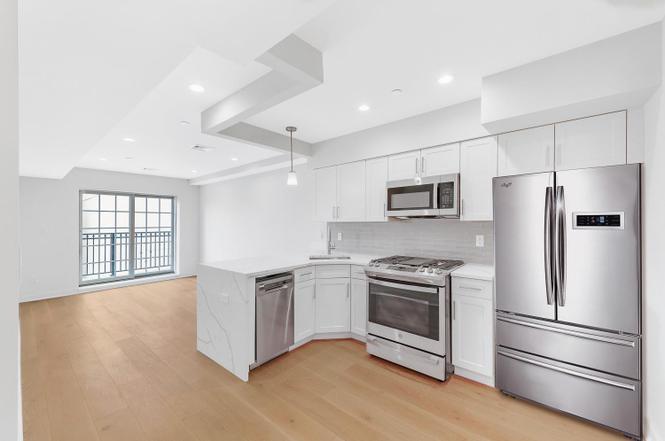
23-23 30th Rd #3
New York, NY 11102
$648,000D-
1 bd · 1.0 ba ·
628 sqft ·
Built 2022
· Condo
· Pending
· 19 DOM
Cashflow @ list (25.0% down · 7.5%)
Estimated rent
$4,963/mo
Mortgage (P&I)
−$3,398
Tax + insurance
−$1,080
HOA
−$420
Vac / Maint / Mgmt
−$1,042
Net cashflow
$-977/mo
Annual
$-11,728/yr
Cap rate
4.48%
Cash-on-cash
-6.46%
DSCR
0.71
1% rule
0.77%
Cash to close
$181,440
Investor read
- This is a 1-bed/1.0-bath condo listed at $648k.
- At list price, monthly cash flow is $-977 ($-12k/yr) — negative.
- To cash-flow at today's rent, offer at most $507k (21.8% below list).
- To meet the 1% rule (rent ≥ 1% of price), the offer needs to be $496k (23.4% below list).
- It's been on market 19 days — a 2% lower offer ($638k) is reasonable based on typical stale-listing flexibility.
- Recommended offer: $496k (23.4% below list) — sets the bar for 1% rule.
- In year one you build about $6k of equity ($4k loan paydown + $1k appreciation (0.2% local appreciation)).
- Location reads 75/100 on livability (#268 in NY, #4,188 nationally) — a middle-class / working-renter tenant base. Strengths: amenities A+, commute A+, health & safety A; Watch: crime F, cost of living F.
- Market conditions: Rents rising fast (+4.8%/yr); 114 active listings in the ZIP; 16 comparable units currently listed for rent nearby; rentals at typical pace (median 19d on market — plan ~3-4 weeks tenant-placement turnaround); solid renter incomes; 5,302 units permitted in Queens County in 2024 (4,918 in 5+ unit buildings).
- Queens County population projected at +16% by 2050 — long-run rental-demand tailwind backs the buy-and-hold thesis.
- By year 6, paydown + projected appreciation supports a ~$37k cash-out refi (75% LTV) — recoverable capital for the next deal without selling this one.
- Climate carrying-cost: major wind risk, 27% chance of damaging wind over 30y; extreme-heat days projected 7→15/yr by 2055 (HVAC capex compounding) — expect insurance premiums to compound above CPI over the hold.
- Cap rate 4.5% vs local median 2.6% in New York — top-decile yield for the area; either an underpriced asset or a hidden risk that comps aren't pricing in. Stress-test before assuming the spread holds.
- At $4,963/mo this rent would consume 62% of the median local household income ($97k/yr) (locally 2407% of renters already pay >50% of income on rent) — very limited rent-growth headroom before tenants either downsize or default.
Questions for listing agent
- What do current leases actually rent for vs. the listed asking? Can we see a recent rent roll and the last 12 months of T-12 income?
- What does the HOA fee cover, when was the last increase, and are there any pending special assessments or reserve-fund shortfalls?
- Any open or pending special assessments — roof, HVAC, plumbing, elevator, façade? What's the per-unit balance and payoff schedule, and is the seller paying it off at close or rolling it to the buyer?
- Is there a deadline driving the sale (1031 exchange, divorce, estate, relocation)? That informs how much negotiation room exists.
- Schools are B-rated — typically a magnet for longer-tenancy family renters. What's the average tenant stay here, and is there a school-zone premium baked into asking?
- Crime grade is F in this area — have there been break-ins, vandalism, or insurance claims at this property in the last 3 years? What carrier currently insures it and at what premium?
- The area grade is low — what's the realistic commute time and amenity access for the typical tenant pool here? Any planned neighborhood developments (good or bad) we should know about?
- What's the average days-on-market for RENTAL listings here right now (not sales)? A rising rental-DOM trend means longer vacancies and softer asking-rent achievability than the comps imply.
CashFlowRE · CFR-2TA69C8A2BRGD6
· Data 1 week ago
cashflowre.app · 2026-05-29