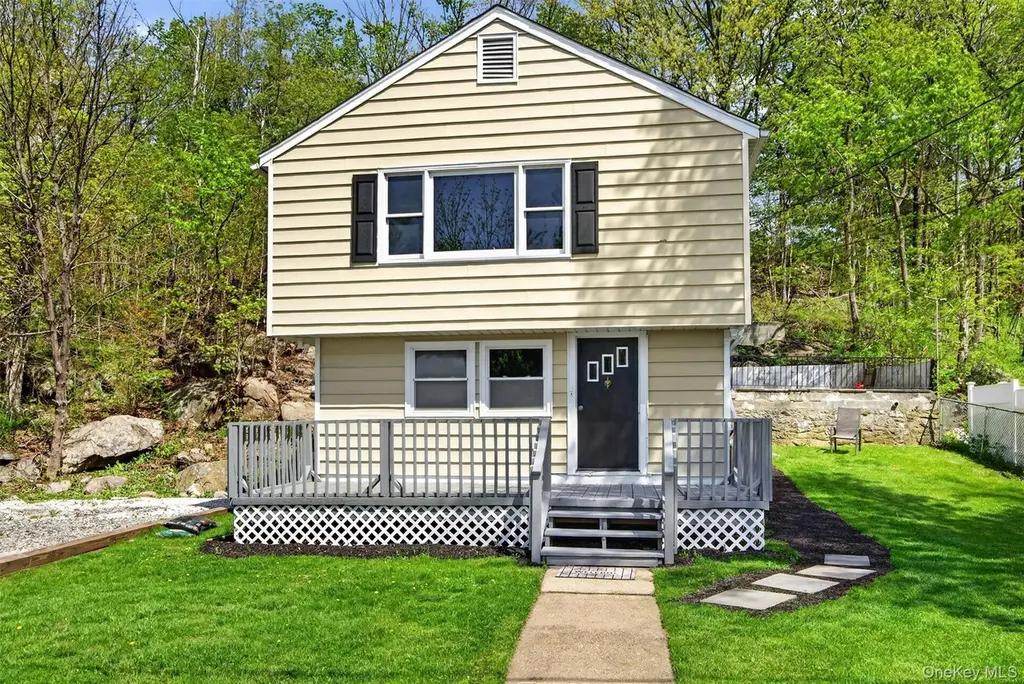
12 Montrose Dr
Lake Carmel, NY 10512
$409,000D
2 bd · 1.0 ba ·
1,589 sqft ·
Built 1960
· SingleFamily
· Active
· 46 DOM
Cashflow @ list (25.0% down · 7.5%)
Estimated rent
$4,250/mo
Mortgage (P&I)
−$2,145
Tax + insurance
−$1,722
HOA
−$0
Vac / Maint / Mgmt
−$892
Net cashflow
$-510/mo
Annual
$-6,118/yr
Cap rate
4.80%
Cash-on-cash
-5.34%
DSCR
0.76
1% rule
1.04%
Cash to close
$114,520
Investor read
- This is a 2-bed/1.0-bath single-family listed at $409k.
- At list price, monthly cash flow is $-510 ($-6k/yr) — negative.
- To cash-flow at today's rent, offer at most $372k (8.9% below list).
- Meets the 1% rule at list price ($4k rent vs $409k).
- It's been on market 46 days — a 3% lower offer ($397k) is reasonable based on typical stale-listing flexibility.
- Recommended offer: $372k (8.9% below list) — sets the bar for cash-flow.
- Local home prices are declining (-3.0%/yr); year-one equity from $3k of loan paydown is wiped out by about $12k of value loss. Plan a longer hold.
- Location reads 66/100 on livability (#650 in NY) — a middle-class / working-renter tenant base. Strengths: employment A+, housing A+; Watch: amenities F, commute F, cost of living F.
- Carmel Central School District (suburban): math 46% / reading 63% proficiency, ranked #258 of 590 in NY (top 44%) — acceptable for families but not a draw, mixed tenant base, ~2y average lease; only 17% free/reduced lunch — higher-income household profile.
- Zoned schools: Matthew Paterson Elementary School (math 47% / reading 62%, grade C, #908 of 2,108 statewide, top 46%, 488 students, 41% FRL); George Fischer Middle School (math 21% / reading 56%, grade F, #437 of 729 statewide, top 60%, 1,130 students, 38% FRL); Carmel High School (math 97% / reading 87%, grade A+, #171 of 1,100 statewide, top 18%, 1,365 students, 36% FRL) — zoned schools average 38% FRL vs 17% district-wide (22 pts higher); higher-poverty schools than district average — tighter screening recommended.
- Watch-outs: property tax is 4.6% of price.
- Market conditions: 233 active listings in the ZIP; 1 comparable units currently listed for rent nearby; 142 units permitted in Putnam County in 2024 (75 in 5+ unit buildings).
- Putnam County population projected to shrink 3% by 2050 — rents likely to lag national; underwrite the cash flow, not the appreciation.
- 8 sale attempts since 23y ago with the ask held roughly flat each time — persistent listings suggest the price (not the market) is what's stuck; bring a comps-based counter.
- Current owner paid $180k; list at $409k implies a 127% gain — meaningful room to come down on a strong offer.
- Cap rate 4.8% vs local median 2.3% in Lake Carmel — top-decile yield for the area; either an underpriced asset or a hidden risk that comps aren't pricing in. Stress-test before assuming the spread holds.
Questions for listing agent
- What do current leases actually rent for vs. the listed asking? Can we see a recent rent roll and the last 12 months of T-12 income?
- It's been on market 46 days. Have you received any prior offers? Is the seller open to a 9% concession, seller financing, or rate buy-down credit?
- Built in 1960 — when were the roof, HVAC, electrical panel, plumbing, and water heater last replaced?
- Property tax is high relative to price — has the assessment been appealed recently, and will the sale trigger a re-assessment?
- Is there a deadline driving the sale (1031 exchange, divorce, estate, relocation)? That informs how much negotiation room exists.
- Schools are D-rated, which usually means shorter tenancies and higher turnover. Who's the typical renter profile here, and what's been the actual vacancy rate?
- The area grade is low — what's the realistic commute time and amenity access for the typical tenant pool here? Any planned neighborhood developments (good or bad) we should know about?
- What's the average days-on-market for RENTAL listings here right now (not sales)? A rising rental-DOM trend means longer vacancies and softer asking-rent achievability than the comps imply.
CashFlowRE · CFR-2TGV0BB5AP7XCF
· Data 21 h ago
cashflowre.app · 2026-05-29