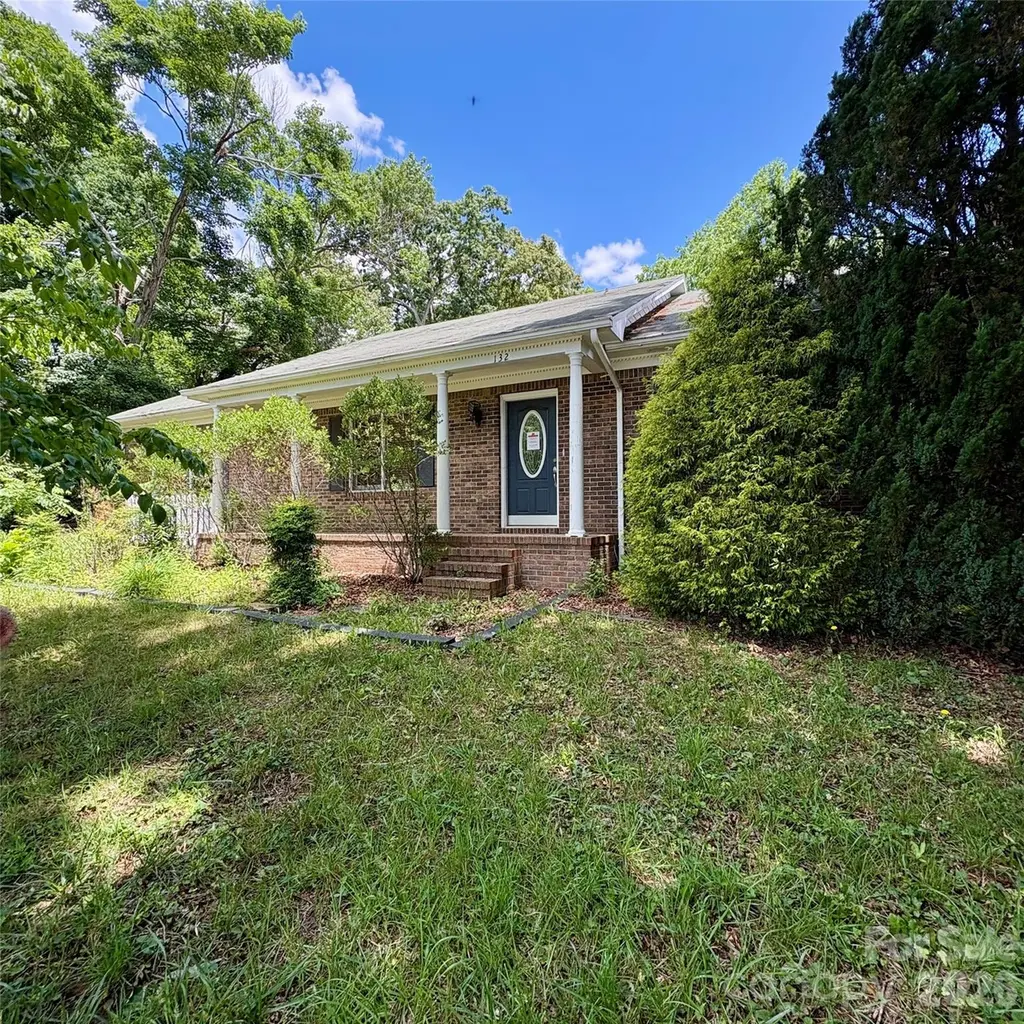
132 Haynes St
Balfour, NC 28791
$269,000C
3 bd · 2.0 ba ·
1,736 sqft ·
Built 1979
· SingleFamily
· Active
· 15 DOM
Cashflow @ list (25.0% down · 7.5%)
Estimated rent
$2,463/mo
Mortgage (P&I)
−$1,411
Tax + insurance
−$231
HOA
−$0
Vac / Maint / Mgmt
−$517
Net cashflow
$304/mo
Annual
$3,653/yr
Cap rate
7.65%
Cash-on-cash
4.85%
DSCR
1.22
1% rule
0.92%
Cash to close
$75,320
Investor read
- This is a 3-bed/2.0-bath single-family listed at $269k.
- At list price, monthly cash flow is $304 ($4k/yr) — positive.
- The deal already cash-flows at list — no discount required.
- To meet the 1% rule (rent ≥ 1% of price), the offer needs to be $246k (8.4% below list).
- It's been on market 15 days — a 2% lower offer ($265k) is reasonable based on typical stale-listing flexibility.
- Recommended offer: $246k (8.4% below list) — sets the bar for 1% rule.
- Local home prices are declining (-3.0%/yr); year-one equity from $2k of loan paydown is wiped out by about $8k of value loss. Plan a longer hold.
- Location reads 64/100 on livability (#338 in NC) — a middle-class / working-renter tenant base. Strengths: crime A+, cost of living A+, housing A+; Watch: amenities F, commute F, health & safety F.
- Henderson County Schools (suburban): math 48% / reading 52% proficiency, ranked #64 of 178 in NC (top 36%) — acceptable for families but not a draw, mixed tenant base, ~2y average lease.
- Zoned schools: Clear Creek Elementary (math 39% / reading 44%, grade F, #673 of 1,410 statewide, top 48%, 484 students, 70% FRL); Hendersonville High (math 57% / reading 77%, grade B, #142 of 535 statewide, top 28%, 784 students, 43% FRL).
- Market conditions: 149 active listings in the ZIP; 8 comparable units currently listed for rent nearby; rentals at typical pace (median 24d on market — plan ~3-4 weeks tenant-placement turnaround); solid renter incomes; 1,534 units permitted in Henderson County in 2024 (558 in 5+ unit buildings).
- Henderson County population projected at +20% by 2050 — long-run rental-demand tailwind backs the buy-and-hold thesis.
- 5 sale attempts with the ask held roughly flat each time — persistent listings suggest the price (not the market) is what's stuck; bring a comps-based counter.
- Current owner paid $186k; 45% above their basis — modest negotiation headroom, anchor on the comps not their cost.
- This rent runs 38% of the median local income ($79k/yr) — at the standard rent-burdened threshold; future hikes will face affordability resistance.
Questions for listing agent
- Built in 1979 — when were the roof, HVAC, electrical panel, plumbing, and water heater last replaced?
- Is there a deadline driving the sale (1031 exchange, divorce, estate, relocation)? That informs how much negotiation room exists.
- Schools are F-rated, which usually means shorter tenancies and higher turnover. Who's the typical renter profile here, and what's been the actual vacancy rate?
- What's the average days-on-market for RENTAL listings here right now (not sales)? A rising rental-DOM trend means longer vacancies and softer asking-rent achievability than the comps imply.
- What's the recent tenant-quality profile in this submarket — average credit score on applications, eviction rate, late-payment / NSF rate, and stable-employment percentage? A property-management company in the area should have these aggregated.
- How much new for-sale + rental construction is in the pipeline within 1–3 miles? Heavy new supply typically softens prices + rents 12–24 months out; constrained supply supports both.
CashFlowRE · CFR-2W24R3AZBSFP4F
· Data 2 days ago
cashflowre.app · 2026-05-29