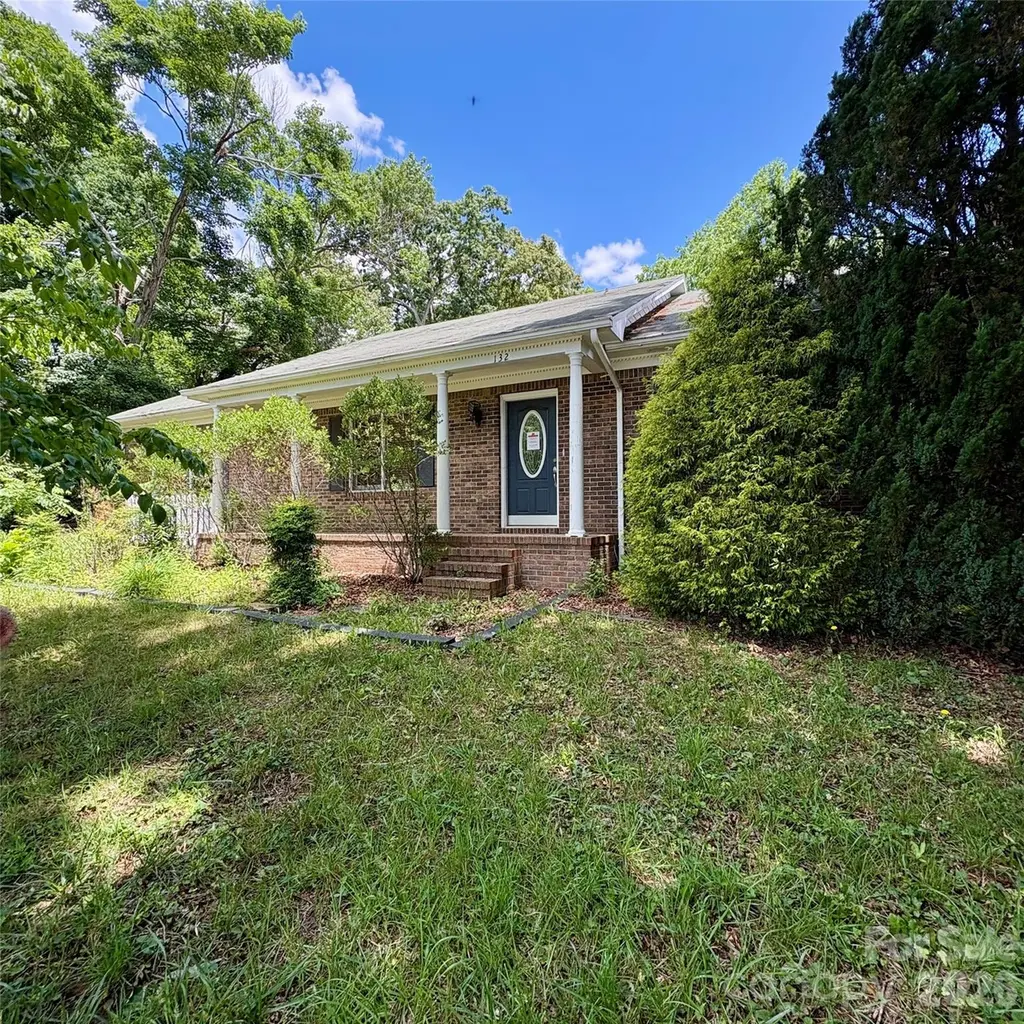
132 Haynes St · Balfour, NC
Flood risk 1/10 · Minimal
- FEMA flood zone
- X (unshaded)
- Chance of flooding over 30 yrs
- 0.0%
- Est. flood insurance / yr
- $507 – $1,088
Fire risk 2/10 · Minimal
- Est. fire insurance / yr
- $906 – $1,684
Heat risk 4/10 · Minor
- Hot days now (above 98°F)
- 7 days/yr
- Hot days in 30 yrs
- 18 days/yr
Wind risk 2/10 · Minimal
- Chance of severe wind over 30 yrs
- —
Air-quality risk 3/10 · Minor
- Unhealthy air days now
- 2 days/yr
- Unhealthy air days in 30 yrs
- 3 days/yr
Risk factors via First Street. Map © Google.
Why this score? — see what drove the C grade
The composite is a weighted blend of 9 inputs, each scored 0–100. Each bar is that input's sub-score; the figure is the points it added to the 100-point composite (weight × sub-score).
- Cash flow +19.5/30.0
- ARV discount +15.0/15.0
- DSCR +6.2/10.0
- 1% rule +4.2/10.0
- Schools +4.2/10.0
- Livability +3.2/5.0
- Rent growth +2.5/5.0
- Condition / age +2.5/5.0
- Appreciation +0.0/10.0
$269,000
🖨 Deal sheet 📄 Offer letter ✓ Due diligence
Listing remarks
GREAT POTENTIAL in this large brick ranch in Hendersonville, NC! 3BR/2BA, over 1700 sq ft, hdwd floors, large living room w/ FP, large kitchen/dining area & pantry, laundry closet, plus additional huge family room w/ rear entrance! Covered front porch. Double detached garage w/ small half bath (roof issues). Septic tank currently inoperable. Quote to repair in attachments. Property sold AS IS/WHERE IS. * Unknown if driveway is shared * * All information taken from public tax records and must be verified by buyer/agent prior to closing. Listed below tax value!
Key facts
- Covered front porch
- Huge family room
- Large living room
Tags
Property features AI
Finance
- HOA & community: No HOA
Exterior
- Parking: Detached 2-car garage with driveway (garage ~901 sq ft)
- Utilities: City water; Septic system installed
- Home design: Single-family residence, site-built; One level; Zoned R-15
- Construction: Brick exterior; Crawl space foundation
- Exterior features: Covered front porch; Lot is level to sloped; Asphalt-paved public road frontage
Interior
- Kitchen: Dishwasher; Electric range
- Bedrooms: 3 bedrooms (all on the main level)
- Bathrooms: 2 full bathrooms
- Heating & cooling: Heating: Other (see remarks); Cooling: Other (see remarks)
- Interior features: 7 total rooms; Living room fireplace
- Laundry & utility: Main-level laundry closet
Neighborhood map
What this means for you Summary
Snapshot
- This is a 3-bed/2.0-bath single-family listed at $269k.
Deal economics
- At list price, monthly cash flow is $304 ($4k/yr) — positive.
- The deal already cash-flows at list — no discount required.
- To meet the 1% rule (rent ≥ 1% of price), the offer needs to be $246k (8.4% below list).
- Recommended offer: $246k (8.4% below list) — sets the bar for 1% rule.
Location & tenants
- Location reads 64/100 on livability (#338 in NC) — a middle-class / working-renter tenant base. Strengths: crime A+, cost of living A+, housing A+; Watch: amenities F, commute F, health & safety F.
- Henderson County Schools (suburban): math 48% / reading 52% proficiency, ranked #64 of 178 in NC (top 36%) — acceptable for families but not a draw, mixed tenant base, ~2y average lease.
- Zoned schools: Clear Creek Elementary (math 39% / reading 44%, grade F, #673 of 1,410 statewide, top 48%, 484 students, 70% FRL); Hendersonville High (math 57% / reading 77%, grade B, #142 of 535 statewide, top 28%, 784 students, 43% FRL).
- Market conditions: 149 active listings in the ZIP; 8 comparable units currently listed for rent nearby; rentals at typical pace (median 23d on market — plan ~3-4 weeks tenant-placement turnaround); solid renter incomes; 1,534 units permitted in Henderson County in 2024 (558 in 5+ unit buildings).
- This rent runs 38% of the median local income ($79k/yr) — at the standard rent-burdened threshold; future hikes will face affordability resistance.
Forward outlook
- Local home prices are declining (-3.0%/yr); year-one equity from $2k of loan paydown is wiped out by about $8k of value loss. Plan a longer hold.
- Henderson County population projected at +20% by 2050 — long-run rental-demand tailwind backs the buy-and-hold thesis.
Negotiation context
- It's been on market 15 days — a 2% lower offer ($265k) is reasonable based on typical stale-listing flexibility.
- 5 sale attempts with the ask held roughly flat each time — persistent listings suggest the price (not the market) is what's stuck; bring a comps-based counter.
- Current owner paid $186k; 45% above their basis — modest negotiation headroom, anchor on the comps not their cost.
Questions for the listing agent
- Built in 1979 — when were the roof, HVAC, electrical panel, plumbing, and water heater last replaced?
- Is there a deadline driving the sale (1031 exchange, divorce, estate, relocation)? That informs how much negotiation room exists.
- Schools are F-rated, which usually means shorter tenancies and higher turnover. Who's the typical renter profile here, and what's been the actual vacancy rate?
- What's the average days-on-market for RENTAL listings here right now (not sales)? A rising rental-DOM trend means longer vacancies and softer asking-rent achievability than the comps imply.
- What's the recent tenant-quality profile in this submarket — average credit score on applications, eviction rate, late-payment / NSF rate, and stable-employment percentage? A property-management company in the area should have these aggregated.
- How much new for-sale + rental construction is in the pipeline within 1–3 miles? Heavy new supply typically softens prices + rents 12–24 months out; constrained supply supports both.
Investment metrics
- 1% rule
- 0.92% ✗
- Cap rate
- 7.65%
- Cash-on-cash
- 4.85%
- DSCR
- 1.22
- GRM
- 9.1
CMA / ARV
- ARV (on-the-fly)
- $447,888
- Comps found
- 12
Show comp detail 12 sales within ~0.75 mi
| Address | Dist | Beds/Ba | Sqft | Sold | Price | $/sf | Match |
|---|---|---|---|---|---|---|---|
| 402 Comet Dr | 0.32mi | 3/2.0 | 1,606 (-8%) | 6mo | $375,000 | $233 | 68 |
| 239 Stonebrook Dr | 0.73mi | 3/2.0 | 1,754 (+1%) | 3mo | $452,500 | $258 | 62 |
| 2375 Rosemont Ct | 0.73mi | 3/2.0 | 1,662 (-4%) | 6mo | $495,000 | $298 | 54 |
| 308 Darnell Dr | 0.57mi | 3/2.0 | 1,792 (+3%) | 18mo | $355,000 | $198 | 53 |
| 2205 N Stoney View Ct | 0.19mi | 3/2.0 | 1,534 (-12%) | 24mo | $430,000 | $280 | 52 |
| 215 Browning Ave | 0.69mi | 2/2.0 (-1) | 1,612 (-7%) | 0mo | $328,000 | $203 | 50 |
| 2025 S Stoney View Ct | 0.34mi | 3/2.0 | 1,515 (-13%) | 17mo | $428,000 | $283 | 49 |
| 211 Lyndon Ln | 0.33mi | 3/2.0 | 1,551 (-11%) | 23mo | $370,000 | $239 | 48 |
| 82 Lillycrop Ln | 0.74mi | 3/2.0 | 1,596 (-8%) | 10mo | $545,000 | $341 | 44 |
| 1727 Meadowbrook Ter | 0.74mi | 3/2.0 | 1,916 (+10%) | 10mo | $333,000 | $174 | 40 |
| 1721 Clairmont Dr | 0.70mi | 3/2.0 | 1,948 (+12%) | 9mo | $550,000 | $282 | 39 |
| 232 Stone Brook Dr | 0.69mi | 3/2.0 | 1,515 (-13%) | 9mo | $387,500 | $256 | 39 |
Match score weights: distance 35% · size 25% · config 20% · recency 20%. Top-matched comps best support the ARV.
Projected returns pro-forma
-3.0% appreciation · 3.0% rent growth · sell at horizon
- IRR
- -8.8%
- Equity multiple
- 0.68×
- Total profit
- $-24,299
- Equity at exit
- $40,109
- IRR
- 0.6%
- Equity multiple
- 1.05×
- Total profit
- $3,413
- Equity at exit
- $23,258
Cash invested: $75,320 (down + closing). Projections, not guarantees.
Landlord ↔ Tenant lean methodology
- Overall (STATE)
- 85 Strongly Landlord-Friendly
- State North Carolina
- 85 Strongly Landlord-Friendly · R+3
- County
- — inherits STATE
- City
- — inherits STATE
ZIP-level market 28791
- Active inventory
- 149
- Price-to-rent
- 9.1×
Monthly cashflow live
- Estimated rent
- $2,463 high interval (Pro) →
- Mortgage (P&I)
- −$1,411
- Tax from tax record
- −$119 /mo · $1,428/yr
- Insurance
- −$112
- HOA
- −$0
- Vacancy / Maint / Mgmt
- −$517
- Net cashflow
- $304
Break-even live
UW: 25.0% down · 7.5% · 30yr · 1.5% tax · 5.0% vac · 8.0% maint · 8.0% mgmt
Financing live
Cash to close
- Down payment
- $67,250
- Closing costs
- $8,070
- Reserves months
- —
- Total cash needed
- —
Loan-product check · same deal, 3 products live
Conventional
25% down · 7.5% · 30yr
- Down + closing
- —
- Monthly P&I
- —
- Monthly cashflow
- —
- DSCR
- —
- Eligible?
- —
Personal DTI + credit; lowest rate.
DSCR
20% down · 8.5% · 30yr
- Down + closing
- —
- Monthly P&I
- —
- Monthly cashflow
- —
- DSCR
- —
- Eligible?
- —
No personal income docs; deal must DSCR.
Hard money
10% down · 12.0% · 12mo
- Down + closing
- —
- Monthly P&I
- —
- Monthly cashflow
- —
- DSCR
- —
- Eligible?
- —
Short-term bridge; refi at stabilization.
Rent comps 8 comps
| Address | Beds | Baths | Sqft | Rent | $/sqft | DOM | Units | Dist |
|---|---|---|---|---|---|---|---|---|
| 14 Cornerstone Way Hendersonville, NC | 2.0 | 2.0 | 1200 | $1,795 | $1.50 | 21d | 1 | 0.25mi |
| 1830 Lower Ridgewood Blvd Unit 1828 Hendersonville, NC | 3.0 | 2.5 | 2000 | $2,200 | $1.10 | 23d | 1 | 0.56mi |
| 1761 Haywood Manor Rd Hendersonville, NC | 2.0 | 2.0 | 1080 | $1,600 | $1.48 | 13d | 1 | 0.94mi |
| 73 Eastbury Dr Hendersonville, NC | 2.0 | 2.0 | 1109 | $1,775 | $1.60 | 23d | 5 | 1.02mi |
| 130 Creekview Rd Hendersonville, NC | 3.0 | 2.5 | 1774 | $2,495 | $1.41 | 23d | 1 | 1.29mi |
| 146 Creekview Rd Unit 1 Hendersonville, NC | 3.0 | 2.5 | 1700 | $2,595 | $1.53 | 23d | 1 | 1.30mi |
| 146 Creekview Rd Hendersonville, NC | 3.0 | 3.0 | 1700 | $2,595 | $1.53 | 23d | 1 | 1.30mi |
| 21 Cedar Hill Rd Hendersonville, NC | 3.0 | 2.5 | 1674 | $2,300 | $1.37 | 21d | 1 | 1.32mi |
Listing history 12 events
-
2026-06-18days on market $269,000 Active 15 DOM
-
2026-06-17days on market $269,000 Active 14 DOM
-
2026-06-16days on market $269,000 Active 13 DOM
-
2026-06-15days on market $269,000 Active 12 DOM
-
2026-06-14days on market $269,000 Active 10 DOM
-
2026-06-13days on market $269,000 Active 9 DOM
-
2026-06-10days on market $269,000 Active 7 DOM
-
2026-06-09days on market $269,000 Active 6 DOM
-
2026-06-08days on market $269,000 Active 5 DOM
-
2026-06-07days on market $269,000 Active 4 DOM
-
2026-06-05remarks 570-char remark
-
2026-06-05$269,000 Active 1 DOM
ⓘ Source: listings_history table (triggers on properties + properties_extension) + one-shot
backfill from property_details.listing_events for pre-trigger history.
Tax reassessment forecast NC · Resets to sale price
- Current annual tax
- $1,428 · $119/mo
- Projected year-2 tax
- $2,206 · $184/mo
- Expected delta
- +$778/yr (+$65/mo · 54.5%)
ⓘ Screening estimate from a state-policy table — verify with the county assessor before closing.
Climate risk First Street
- Flood 1/10 Low FEMA zone X (unshaded) · 0% chance over 30 yrs
- Wildfire 2/10 Low
- Heat 4/10 Moderate 7 d/yr ≥98°F today · 18 d/yr by 30 yrs out
- Wind 2/10 Low
- Air quality 3/10 Moderate 2 unhealthy d/yr today · 3 by 30 yrs out
Nearby sold comps map
Loading sold comps map…
Walkable amenities ~0.75 mi
Loading nearby amenities…
Taxation est. · year 1
- Rental income
- $29,561
- − Mortgage interest
- −$15,068
- − Property taxes
- −$1,428
- − Insurance
- −$1,345
- − Repairs & maintenance
- −$2,365
- − Management
- −$2,365
- − Depreciation
- −$7,825
- Taxable loss
- −$835
- Est. tax savings @ 24.0%
- +$200
- After-tax cash flow
- $3,853/yr
For passive investors: Depreciation is non-cash, so a rental often shows a tax loss while cash-flowing — sheltering income. Rental losses are passive: they offset passive income freely, and up to $25,000/yr can offset ordinary (W-2) income if you actively participate and your MAGI is under $100k (phasing out to $0 by $150k); unused losses carry forward. On sale, claimed depreciation is recaptured at up to 25%, and gains may owe capital-gains tax (a 1031 exchange can defer both). Figures are a year-1 estimate at your 24.0% rate — not tax advice; consult a CPA.
Schools (NCES district)
- District
- Henderson County Schools
- NCES district ID
- 3702100
- Math proficiency
- 48% ▼ -2.00%
- Reading proficiency
- 52% ▼ -2.00%
- Median HH income
- $47,101
- Composite
- 42.5/100
- National rank
- #3206
- State rank
- #64 of 178 in NC
Livability — Balfour
- Score
- 64/100
- State rank
- #338
- US rank
- #13691
Category grades
Schools grade is shown separately in the Schools card above.
Census & demographics
- Census place
- Balfour, NC
- County
- Henderson County · 78,587 people
- Metro
- Asheville, NC
- Population (ZIP)
- 15,108
- Household income
- $78,827
- Rent vs Own
- Severe rent burden
- 253.0
Population outlook (Henderson County) Hauer SSP2
- Today (2025)
- 124,075 people
- By 2030
- 129,690 · +4.5%
- By 2040
- 139,898 · +12.8%
- By 2050
- 148,298 · +19.5%
- By 2075
- 163,980 · +32.2%
- By 2100
- 166,962 · +34.6%
Race, ethnicity, and origin ACS 2023
- Neighborhood character
- Predominantly White (83%)
- Race & ethnicity
- White 83% Hispanic / Latino 10% Two or more races 6% Asian 2% Black 2%
- Hispanic origin (detail)
- Mexican 6%
- Common ancestry
- Romanian 4% Slovak 3% Serbian 3%
- Foreign-born
- 8% · Canada, Jamaica
- Languages at home
- 92% English-only · Spanish 5% Other Asian/Pacific 1% German/W. Germanic 1%
Political lean MEDSL · Henderson
- 2024 margin
- R (+14.6) · D 42.1% · R 56.7% · Other 1.1%
- 2008→2024 swing
- +6.5pp toward D · 2008: -21.0pp · 2024: -14.6pp
- All cycles
- 2024: R+14.6 2020: R+18.8 2016: R+27.9 2012: R+27.6 2008: R+21.0
Not yet ingested
- Civics
- —
Market trends
- HPI YoY
- ▼ -160.98%
- Current HPI
- 207.4921
- Rent YoY
- —
- Metro
- Asheville, NC
- State GDP YoY
- ▲ 3.28%
- F500 in state
- 26
Industry mix (Fortune 500 HQ in NC)
| Industry | F500 HQs | Revenue |
|---|---|---|
| Financial Services | 2 | $213B |
|
||
| Retail | 2 | $95B |
|
||
| Industrial Conglomerate | 1 | $38B |
|
||
| Metals / Steel | 1 | $35B |
|
||
| Utilities | 1 | $30B |
|
||
| Industrial Machinery | 1 | $19B |
|
||
Price history
+96.4% since first listed9 events — show timeline
- 2026-06-03 Listed $269,000 CANOPYMLS as Distributed by MLS Grid
- 2026-05-01 Relisted — CANOPYMLS as Distributed by MLS Grid
- 2026-04-13 Relisted — CANOPYMLS as Distributed by MLS Grid
- 2026-02-13 Pending — CANOPYMLS as Distributed by MLS Grid
- 2026-01-08 Relisted — CANOPYMLS as Distributed by MLS Grid
- 2025-11-11 Contingent — CANOPYMLS as Distributed by MLS Grid
- 2025-10-08 Listed $299,000 CANOPYMLS as Distributed by MLS Grid
- 2006-06-13 Sold (Public Records) $186,000 Public Records
- 2003-09-15 Sold (Public Records) $137,000 Public Records
Property tax history
+4.3%/yrLatest (2025): $1,428 · +0.0% YoY. Source: county tax records.
Cash-flow waterfall
monthlySold comps — $/sqft
last 12 mo · ≤1 miLoading sold comps…