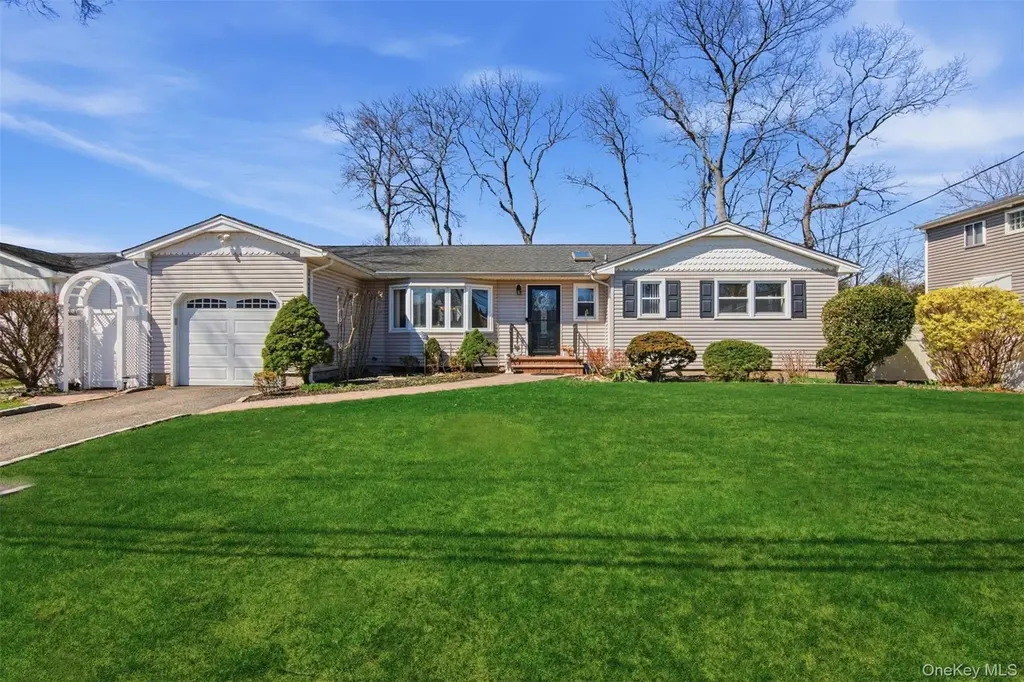
64 Avenue D
Holbrook, NY 11741
$619,000F
3 bd · 1.5 ba ·
1,415 sqft ·
Built 1965
· SingleFamily
· Pending
· 7 DOM
Cashflow @ list (25.0% down · 7.5%)
Estimated rent
$3,807/mo
Mortgage (P&I)
−$3,246
Tax + insurance
−$483
HOA
−$0
Vac / Maint / Mgmt
−$799
Net cashflow
$-722/mo
Annual
$-8,663/yr
Cap rate
4.89%
Cash-on-cash
-5.00%
DSCR
0.78
1% rule
0.61%
Cash to close
$173,320
Investor read
- This is a 3-bed/1.5-bath single-family listed at $619k.
- At list price, monthly cash flow is $-722 ($-9k/yr) — negative.
- To cash-flow at today's rent, offer at most $491k (20.6% below list).
- To meet the 1% rule (rent ≥ 1% of price), the offer needs to be $381k (38.5% below list).
- Only 7 days on market — expect competitive offers; lowballing is unlikely to land.
- Recommended offer: $381k (38.5% below list) — sets the bar for 1% rule.
- Local home prices are declining (-3.0%/yr); year-one equity from $4k of loan paydown is wiped out by about $19k of value loss. Plan a longer hold.
- Location reads 66/100 on livability (#658 in NY) — a middle-class / working-renter tenant base. Strengths: employment A+, housing A+; Watch: amenities F, commute F, cost of living F.
- Sachem Central School District (suburban): math 69% / reading 76% proficiency, ranked #86 of 590 in NY (top 15%) — strong family-tenant draw, lease renewals of 3-5y typical; only 15% free/reduced lunch — higher-income household profile.
- Zoned schools: Nokomis School (math 47% / reading 57%, grade C-, #988 of 2,108 statewide, top 49%, 527 students, 31% FRL); Seneca Middle School (math 62% / reading 62%, grade B+, #136 of 729 statewide, top 20%, 973 students, 22% FRL); Sachem High School North (math 96% / reading 95%, grade A+, #76 of 1,100 statewide, top 7%, 1,923 students, 25% FRL).
- Market conditions: Rents rising fast (+7.3%/yr); 94 active listings in the ZIP; 1 comparable units currently listed for rent nearby; high-income renter base; 1,366 units permitted in Suffolk County in 2024 (216 in 5+ unit buildings).
- Suffolk County population projected to shrink 5% by 2050 — rents likely to lag national; underwrite the cash flow, not the appreciation.
- Climate carrying-cost: major wind risk, 77% chance of damaging wind over 30y; extreme-heat days projected 7→17/yr by 2055 (HVAC capex compounding) — expect insurance premiums to compound above CPI over the hold.
- Cap rate 4.9% vs local median 3.5% in Holbrook — top-decile yield for the area; either an underpriced asset or a hidden risk that comps aren't pricing in. Stress-test before assuming the spread holds.
- This rent runs 32% of the median local income ($144k/yr) — at the standard rent-burdened threshold; future hikes will face affordability resistance.
Questions for listing agent
- What do current leases actually rent for vs. the listed asking? Can we see a recent rent roll and the last 12 months of T-12 income?
- Built in 1965 — when were the roof, HVAC, electrical panel, plumbing, and water heater last replaced?
- Is there a deadline driving the sale (1031 exchange, divorce, estate, relocation)? That informs how much negotiation room exists.
- The area grade is low — what's the realistic commute time and amenity access for the typical tenant pool here? Any planned neighborhood developments (good or bad) we should know about?
- What's the average days-on-market for RENTAL listings here right now (not sales)? A rising rental-DOM trend means longer vacancies and softer asking-rent achievability than the comps imply.
- What's the recent tenant-quality profile in this submarket — average credit score on applications, eviction rate, late-payment / NSF rate, and stable-employment percentage? A property-management company in the area should have these aggregated.
- How much new for-sale + rental construction is in the pipeline within 1–3 miles? Heavy new supply typically softens prices + rents 12–24 months out; constrained supply supports both.
CashFlowRE · CFR-2WVBJ20P5APQG6
· Data 3 weeks ago
cashflowre.app · 2026-05-29