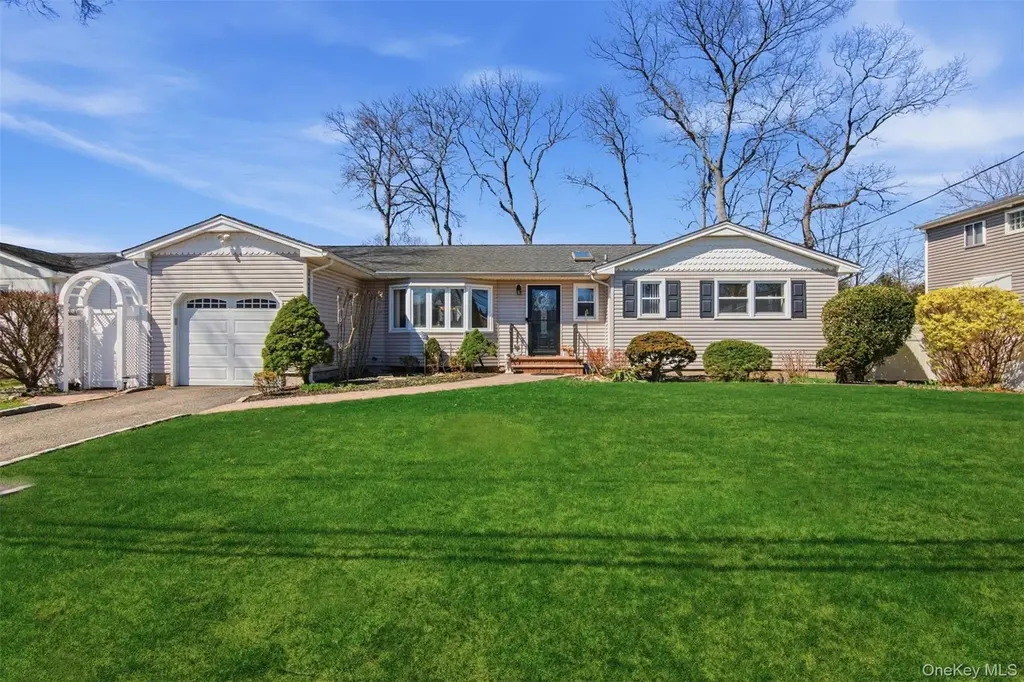
64 Avenue D · Holbrook, NY
Flood risk 1/10 · Minimal
- FEMA flood zone
- X (unshaded)
- Chance of flooding over 30 yrs
- 0.0%
- Est. flood insurance / yr
- $473 – $860
Fire risk 1/10 · Minimal
- Est. fire insurance / yr
- $691 – $1,283
Heat risk 5/10 · Moderate
- Hot days now (above 94°F)
- 7 days/yr
- Hot days in 30 yrs
- 17 days/yr
Wind risk 6/10 · Moderate
- Chance of severe wind over 30 yrs
- 77.0%
Air-quality risk 4/10 · Minor
- Unhealthy air days now
- 4 days/yr
- Unhealthy air days in 30 yrs
- 6 days/yr
Risk factors via First Street. Map © Google.
Why this score? — see what drove the F grade
The composite is a weighted blend of 9 inputs, each scored 0–100. Each bar is that input's sub-score; the figure is the points it added to the 100-point composite (weight × sub-score).
- Cash flow +7.7/30.0
- ARV discount +7.6/15.0
- Schools +6.6/10.0
- Rent growth +4.3/5.0
- Livability +3.3/5.0
- Condition / age +2.5/5.0
- DSCR +1.8/10.0
- 1% rule +1.1/10.0
- Appreciation +0.0/10.0
$619,000
🖨 Deal sheet 📄 Offer letter ✓ Due diligence
Listing remarks
Welcome to this beautiful, move-in ready ranch featuring 3 spacious bedrooms and 1.5 baths. This well-maintained home offers a bright and inviting layout, perfect for both everyday living and entertaining. The interior and exterior reflect true pride of ownership, complemented by beautifully landscaped grounds. Enjoy numerous upgrades, including central air conditioning and 200-amp electrical service. The home also features a beautifully finished basement, providing additional living space with great amenities—ideal for entertaining or relaxing. Step outside to a well-kept yard with in-ground sprinklers and a convenient backyard shed. Situated on a quiet block in a desirable neighborh
Key facts
- 7,841 sq ft lot
- Garage
- Built 1965
Property features AI
Exterior
- Parking: Driveway; 1-car garage
- Utilities: Cesspool sewer; Cable available; Electricity available
- Home design: Single-family residence; Measured living area
- Construction: Frame construction; Finished basement; Full attic
- Exterior features: Frame construction; Not waterfront
Interior
- Kitchen: Electric cooktop; Electric oven; Refrigerator
- Bedrooms: 7 total rooms (includes bedrooms and living spaces)
- Bathrooms: 1 full bathroom; 1 half bathroom
- Heating & cooling: Baseboard heating; Central air conditioning
- Interior features: First-floor bedroom; First-floor full bathroom; Eat-in kitchen; Finished basement; Full attic
- Laundry & utility: Basement utility space
Neighborhood map
What this means for you Summary
Snapshot
- This is a 3-bed/1.5-bath single-family listed at $619k.
Deal economics
- At list price, monthly cash flow is $-722 ($-9k/yr) — negative.
- To cash-flow at today's rent, offer at most $491k (20.6% below list).
- To meet the 1% rule (rent ≥ 1% of price), the offer needs to be $381k (38.5% below list).
- Recommended offer: $381k (38.5% below list) — sets the bar for 1% rule.
- Cap rate 4.9% vs local median 3.5% in Holbrook — top-decile yield for the area; either an underpriced asset or a hidden risk that comps aren't pricing in. Stress-test before assuming the spread holds.
Location & tenants
- Location reads 66/100 on livability (#658 in NY) — a middle-class / working-renter tenant base. Strengths: employment A+, housing A+; Watch: amenities F, commute F, cost of living F.
- Sachem Central School District (suburban): math 69% / reading 76% proficiency, ranked #86 of 590 in NY (top 15%) — strong family-tenant draw, lease renewals of 3-5y typical; only 15% free/reduced lunch — higher-income household profile.
- Zoned schools: Nokomis School (math 47% / reading 57%, grade C-, #988 of 2,108 statewide, top 49%, 527 students, 31% FRL); Seneca Middle School (math 62% / reading 62%, grade B+, #136 of 729 statewide, top 20%, 973 students, 22% FRL); Sachem High School North (math 96% / reading 95%, grade A+, #76 of 1,100 statewide, top 7%, 1,923 students, 25% FRL).
- Market conditions: Rents rising fast (+7.3%/yr); 94 active listings in the ZIP; 1 comparable units currently listed for rent nearby; high-income renter base; 1,366 units permitted in Suffolk County in 2024 (216 in 5+ unit buildings).
- This rent runs 32% of the median local income ($144k/yr) — at the standard rent-burdened threshold; future hikes will face affordability resistance.
Forward outlook
- Local home prices are declining (-3.0%/yr); year-one equity from $4k of loan paydown is wiped out by about $19k of value loss. Plan a longer hold.
- Suffolk County population projected to shrink 5% by 2050 — rents likely to lag national; underwrite the cash flow, not the appreciation.
Negotiation context
- Only 7 days on market — expect competitive offers; lowballing is unlikely to land.
Risks & watch-outs
- Climate carrying-cost: major wind risk, 77% chance of damaging wind over 30y; extreme-heat days projected 7→17/yr by 2055 (HVAC capex compounding) — expect insurance premiums to compound above CPI over the hold.
Questions for the listing agent
- What do current leases actually rent for vs. the listed asking? Can we see a recent rent roll and the last 12 months of T-12 income?
- Built in 1965 — when were the roof, HVAC, electrical panel, plumbing, and water heater last replaced?
- Is there a deadline driving the sale (1031 exchange, divorce, estate, relocation)? That informs how much negotiation room exists.
- The area grade is low — what's the realistic commute time and amenity access for the typical tenant pool here? Any planned neighborhood developments (good or bad) we should know about?
- What's the average days-on-market for RENTAL listings here right now (not sales)? A rising rental-DOM trend means longer vacancies and softer asking-rent achievability than the comps imply.
- What's the recent tenant-quality profile in this submarket — average credit score on applications, eviction rate, late-payment / NSF rate, and stable-employment percentage? A property-management company in the area should have these aggregated.
- How much new for-sale + rental construction is in the pipeline within 1–3 miles? Heavy new supply typically softens prices + rents 12–24 months out; constrained supply supports both.
Investment metrics
- 1% rule
- 0.61% ✗
- Cap rate
- 4.89%
- Cash-on-cash
- -5.00%
- DSCR
- 0.78
- GRM
- 13.6
CMA / ARV
- ARV (on-the-fly)
- $619,770
- Comps found
- 10
Show comp detail 10 sales within ~0.75 mi
| Address | Dist | Beds/Ba | Sqft | Sold | Price | $/sf | Match |
|---|---|---|---|---|---|---|---|
| 1568 Carl Ave | 0.13mi | 3/1.5 | 1,367 (-3%) | 13mo | $611,000 | $447 | 77 |
| 107 Avenue E | 0.09mi | 3/1.5 | 1,271 (-10%) | 11mo | $620,000 | $488 | 70 |
| 18 Norma Blvd | 0.43mi | 3/2.0 | 1,414 (-0%) | 12mo | $630,000 | $446 | 68 |
| 170 Officials Ave | 0.55mi | 3/2.0 | 1,400 (-1%) | 11mo | $600,000 | $429 | 61 |
| 30 Laurel St | 0.38mi | 3/2.0 | 1,462 (+3%) | 20mo | $640,000 | $438 | 58 |
| 8 N 1st St | 0.67mi | 3/2.0 | 1,344 (-5%) | 7mo | $576,000 | $429 | 53 |
| 21 Coleridge Rd | 0.74mi | 4/2.0 (+1) | 1,522 (+8%) | 2mo | $606,000 | $398 | 44 |
| 24 Avenue A | 0.65mi | 2/1.0 (-1) | 1,570 (+11%) | 2mo | $465,000 | $296 | 43 |
| 126 Schmidt Ave | 0.68mi | 2/1.0 (-1) | 1,400 (-1%) | 24mo | $512,500 | $366 | 40 |
| 15 Avenue B | 0.69mi | 3/3.0 | 1,250 (-12%) | 10mo | $615,000 | $492 | 35 |
Match score weights: distance 35% · size 25% · config 20% · recency 20%. Top-matched comps best support the ARV.
Projected returns pro-forma
-3.0% appreciation · 7.3% rent growth · sell at horizon
- IRR
- -20.9%
- Equity multiple
- 0.25×
- Total profit
- $-129,381
- Equity at exit
- $92,295
- IRR
- -7.6%
- Equity multiple
- 0.45×
- Total profit
- $-95,946
- Equity at exit
- $53,520
Cash invested: $173,320 (down + closing). Projections, not guarantees.
Landlord ↔ Tenant lean methodology
- Overall (STATE)
- 15 Strongly Tenant-Friendly
- State New York
- 15 Strongly Tenant-Friendly · D+10
- County
- — inherits STATE
- City
- — inherits STATE
ZIP-level market 11741
- Rents YoY
- 7.3%
- Active inventory
- 94
- Price-to-rent
- 13.6×
Monthly cashflow live
- Estimated rent
- $3,807 medium interval (Pro) →
- Mortgage (P&I)
- −$3,246
- Tax from tax record
- −$225 /mo · $2,702/yr
- Insurance
- −$258
- HOA
- −$0
- Vacancy / Maint / Mgmt
- −$799
- Net cashflow
- $-722
Break-even live
UW: 25.0% down · 7.5% · 30yr · 1.5% tax · 5.0% vac · 8.0% maint · 8.0% mgmt
Financing live
Cash to close
- Down payment
- $154,750
- Closing costs
- $18,570
- Reserves months
- —
- Total cash needed
- —
Loan-product check · same deal, 3 products live
Conventional
25% down · 7.5% · 30yr
- Down + closing
- —
- Monthly P&I
- —
- Monthly cashflow
- —
- DSCR
- —
- Eligible?
- —
Personal DTI + credit; lowest rate.
DSCR
20% down · 8.5% · 30yr
- Down + closing
- —
- Monthly P&I
- —
- Monthly cashflow
- —
- DSCR
- —
- Eligible?
- —
No personal income docs; deal must DSCR.
Hard money
10% down · 12.0% · 12mo
- Down + closing
- —
- Monthly P&I
- —
- Monthly cashflow
- —
- DSCR
- —
- Eligible?
- —
Short-term bridge; refi at stabilization.
Rent comps 1 comps
| Address | Beds | Baths | Sqft | Rent | $/sqft | DOM | Units | Dist |
|---|---|---|---|---|---|---|---|---|
| 2 Hawkins Ave Lake Ronkonkoma, NY | 3.0 | 1.0–2.0 | 959 | $4,980 | $5.19 | 1d | 129 | 1.20mi |
Listing history 2 events
-
2026-05-02status Pending
-
2026-04-09$619,000 Active
ⓘ Source: listings_history table (triggers on properties + properties_extension) + one-shot
backfill from property_details.listing_events for pre-trigger history.
Tax reassessment forecast NY · Partial reset (capped growth)
- Current annual tax
- $2,702 · $225/mo
- Projected year-2 tax
- $6,582 · $548/mo
- Expected delta
- +$3,879/yr (+$323/mo · 143.6%)
ⓘ Screening estimate from a state-policy table — verify with the county assessor before closing.
Climate risk First Street
- Flood 1/10 Low FEMA zone X (unshaded) · 0% chance over 30 yrs
- Wildfire 1/10 Low
- Heat 5/10 Major 7 d/yr ≥94°F today · 17 d/yr by 30 yrs out
- Wind 6/10 Major 77% chance of damaging wind over 30 yrs
- Air quality 4/10 Moderate 4 unhealthy d/yr today · 6 by 30 yrs out
Nearby sold comps map
Loading sold comps map…
Walkable amenities ~0.75 mi
Loading nearby amenities…
Taxation est. · year 1
- Rental income
- $45,680
- − Mortgage interest
- −$34,674
- − Property taxes
- −$2,702
- − Insurance
- −$3,095
- − Repairs & maintenance
- −$3,654
- − Management
- −$3,654
- − Depreciation
- −$18,007
- Taxable loss
- −$20,107
- Est. tax savings @ 24.0%
- +$4,826
- After-tax cash flow
- $-3,837/yr
For passive investors: Depreciation is non-cash, so a rental often shows a tax loss while cash-flowing — sheltering income. Rental losses are passive: they offset passive income freely, and up to $25,000/yr can offset ordinary (W-2) income if you actively participate and your MAGI is under $100k (phasing out to $0 by $150k); unused losses carry forward. On sale, claimed depreciation is recaptured at up to 25%, and gains may owe capital-gains tax (a 1031 exchange can defer both). Figures are a year-1 estimate at your 24.0% rate — not tax advice; consult a CPA.
Schools (NCES district)
- District
- Sachem Central School District
- NCES district ID
- 3625350
- Math proficiency
- 69% ▬ 0.00%
- Reading proficiency
- 76% ▲ 12.00%
- Median HH income
- $92,968
- Composite
- 65.53/100
- National rank
- #472
- State rank
- #86 of 590 in NY
Livability — Holbrook
- Score
- 66/100
- State rank
- #658
- US rank
- #12283
Category grades
Schools grade is shown separately in the Schools card above.
Census & demographics
- Census place
- Holbrook, NY
- County
- Suffolk County · 679,920 people
- City population
- 26,667
- Metro
- New York-Newark-Jersey City, NY-NJ-PA
- Population (ZIP)
- 26,667
- Household income
- $144,346
- Rent vs Own
- Severe rent burden
- 416.0
Population outlook (Suffolk County) Hauer SSP2
- Today (2025)
- 1,505,262 people
- By 2030
- 1,498,318 · -0.5%
- By 2040
- 1,471,101 · -2.3%
- By 2050
- 1,424,848 · -5.3%
- By 2075
- 1,337,157 · -11.2%
- By 2100
- 1,217,720 · -19.1%
Race, ethnicity, and origin ACS 2023
- Neighborhood character
- Predominantly White (75%)
- Race & ethnicity
- White 75% Hispanic / Latino 16% Two or more races 6% Asian 4% Black 3%
- Hispanic origin (detail)
- Puerto Rican 5%
- Common ancestry
- Romanian 6% Lithuanian 2% Scotch-Irish 1%
- Foreign-born
- 11% · Canada, China, Jamaica
- Languages at home
- 84% English-only · Spanish 9% Other Indo-European 2% Chinese 2%
Political lean MEDSL · Suffolk
- 2024 margin
- Lean R (+10.0) · D 45.0% · R 55.0%
- 2008→2024 swing
- -16.0pp toward R · 2008: 6.0pp · 2024: -10.0pp
- All cycles
- 2024: R+10.0 2020: R+0.0 2016: R+8.2 2012: D+2.9 2008: D+6.0
Not yet ingested
- Civics
- —
Market trends
- HPI YoY
- ▼ -682.71%
- Current HPI
- 328.9231
- Rent YoY
- ▲ 7.30%
- Metro
- New York-Newark-Jersey City, NY-NJ-PA
- State GDP YoY
- ▲ 2.60%
- F500 in state
- 92
Industry mix (Fortune 500 HQ in NY)
| Industry | F500 HQs | Revenue |
|---|---|---|
| Financial Services | 10 | $950B |
|
||
| Consumer Goods | 9 | $162B |
|
||
| Insurance | 4 | $225B |
|
||
| Telecommunications | 2 | $144B |
|
||
| Pharmaceuticals | 2 | $112B |
|
||
| Media / Entertainment | 2 | $69B |
|
||
Price history
2 events — show timeline
- 2026-05-02 Pending — OneKey® MLS as Distributed by MLS Grid
- 2026-04-09 Listed $619,000 OneKey® MLS as Distributed by MLS Grid
Property tax history
-9.5%/yrLatest (2017): $2,702 · +5.6% YoY. Source: county tax records.
Cash-flow waterfall
monthlySold comps — $/sqft
last 12 mo · ≤1 miLoading sold comps…