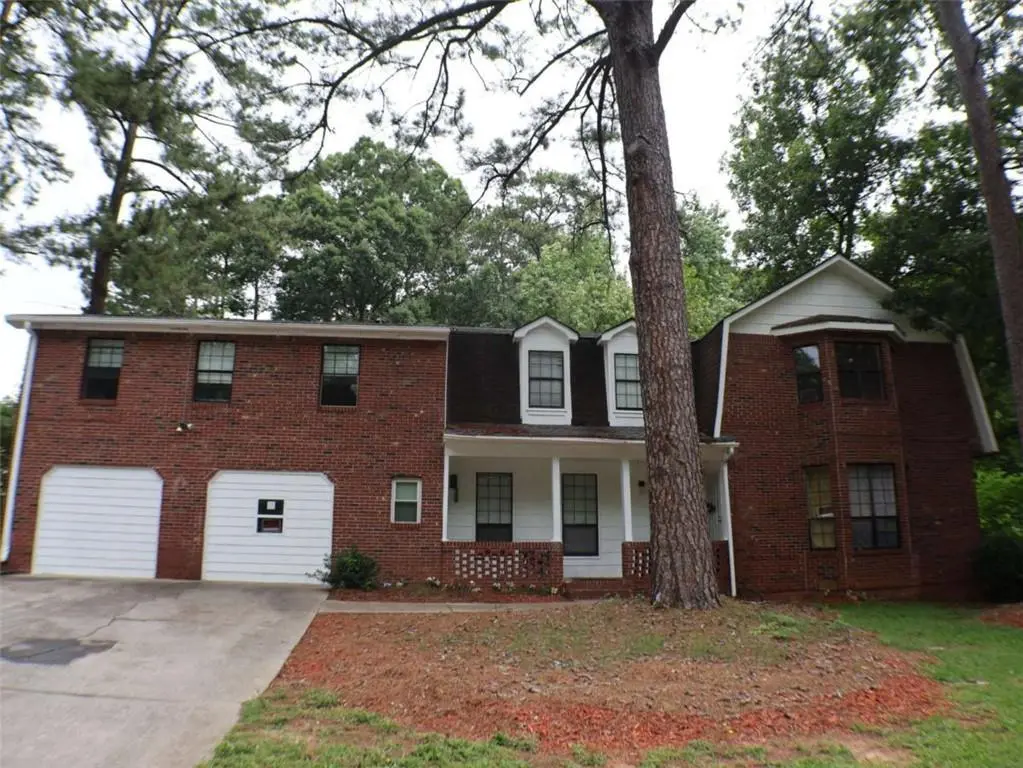
2498 Robinhood Dr
Ellenwood, GA 30294
$459,900D+
6 bd · 7.0 ba ·
3,548 sqft ·
Built 1986
· MultiFamily
· Active
· 18 DOM
Cashflow @ list (25.0% down · 7.5%)
Estimated rent
$4,382/mo
Mortgage (P&I)
−$2,412
Tax + insurance
−$412
HOA
−$0
Vac / Maint / Mgmt
−$920
Net cashflow
$638/mo
Annual
$7,655/yr
Cap rate
7.96%
Cash-on-cash
5.94%
DSCR
1.26
1% rule
0.95%
Cash to close
$128,772
Investor read
- This is a 2×2.0bd/2.5ba + 1×1.0bd/1.0ba units multifamily listed at $460k.
- At list price, monthly cash flow is $638 ($8k/yr) — positive. Per door: $213/mo.
- The deal already cash-flows at list — no discount required.
- To meet the 1% rule (rent ≥ 1% of price), the offer needs to be $438k (4.7% below list).
- It's been on market 18 days — a 2% lower offer ($453k) is reasonable based on typical stale-listing flexibility.
- Recommended offer: $438k (4.7% below list) — sets the bar for 1% rule.
- Local home prices are declining (-3.0%/yr); year-one equity from $3k of loan paydown is wiped out by about $14k of value loss. Plan a longer hold.
- Location reads: area grade D — affects rentability + tenant quality, not the cash-flow math above.
- Clayton County (suburban): math 11% / reading 20% proficiency, ranked #155 of 174 in GA (top 89%) — low school quality limits family demand, transient renter base, plan for 1-2y turnover; 78% free/reduced lunch — lower-income household profile, screen leases tightly.
- Market conditions: Rents rising fast (+4.6%/yr); 244 active listings in the ZIP; solid renter incomes; 865 units permitted in Clayton County in 2024 (448 in 5+ unit buildings).
- Clayton County population projected at +29% by 2050 — long-run rental-demand tailwind backs the buy-and-hold thesis.
- 4 sale attempts with the ask held roughly flat each time — persistent listings suggest the price (not the market) is what's stuck; bring a comps-based counter.
- Current owner paid $148k; list at $460k implies a 212% gain — meaningful room to come down on a strong offer.
- Climate carrying-cost: major wind risk, 27% chance of damaging wind over 30y; extreme-heat days projected 7→18/yr by 2055 (HVAC capex compounding) — expect insurance premiums to compound above CPI over the hold.
- At $4,382/mo this rent would consume 66% of the median local household income ($80k/yr) (locally 864% of renters already pay >50% of income on rent) — very limited rent-growth headroom before tenants either downsize or default.
Questions for listing agent
- Can we see the unit-by-unit rent roll, current vacancy, and any below-market leases? What's the average tenancy length?
- What capital expenditures (roof, boiler, parking lot, exteriors) have been made in the last 5 years, and what's planned in the next 2?
- Is there a deadline driving the sale (1031 exchange, divorce, estate, relocation)? That informs how much negotiation room exists.
- The area grade is low — what's the realistic commute time and amenity access for the typical tenant pool here? Any planned neighborhood developments (good or bad) we should know about?
- What's the average days-on-market for RENTAL listings here right now (not sales)? A rising rental-DOM trend means longer vacancies and softer asking-rent achievability than the comps imply.
- What's the recent tenant-quality profile in this submarket — average credit score on applications, eviction rate, late-payment / NSF rate, and stable-employment percentage? A property-management company in the area should have these aggregated.
- How much new apartment / multifamily construction is in the pipeline within 1–3 miles? Heavy new supply (>2% of stock underway) typically softens rents 12–24 months out; light construction supports rent growth.
CashFlowRE · CFR-2XBDP4DCWQHS1F
· Data 3 weeks ago
cashflowre.app · 2026-05-29