 Triplex
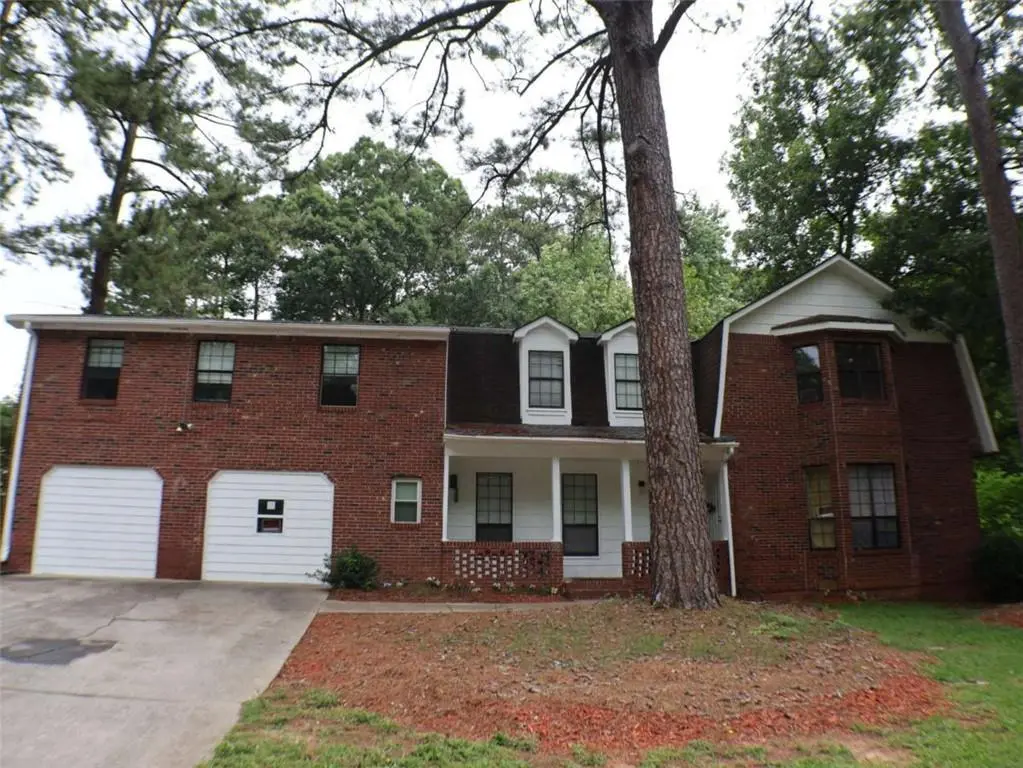
2498 Robinhood Dr · Ellenwood, GA
Flood risk 1/10 · Minimal
- FEMA flood zone
- X (unshaded)
- Chance of flooding over 30 yrs
- 0.0%
- Est. flood insurance / yr
- $507 – $1,088
Fire risk 1/10 · Minimal
- Est. fire insurance / yr
- $963 – $1,789
Heat risk 6/10 · Moderate
- Hot days now (above 105°F)
- 7 days/yr
- Hot days in 30 yrs
- 18 days/yr
Wind risk 6/10 · Moderate
- Chance of severe wind over 30 yrs
- 27.0%
Air-quality risk 4/10 · Minor
- Unhealthy air days now
- 4 days/yr
- Unhealthy air days in 30 yrs
- 6 days/yr
Risk factors via First Street. Map © Google.
Why this score? — see what drove the D+ grade
The composite is a weighted blend of 9 inputs, each scored 0–100. Each bar is that input's sub-score; the figure is the points it added to the 100-point composite (weight × sub-score).
- Cash flow +20.9/30.0
- ARV discount +7.5/15.0
- DSCR +6.6/10.0
- 1% rule +4.5/10.0
- Rent growth +3.6/5.0
- Livability +2.5/5.0
- Condition / age +2.5/5.0
- Schools +1.3/10.0
- Appreciation +0.0/10.0
$459,900
🖨 Deal sheet 📄 Offer letter ✓ Due diligence
Multi-family units
County records classify this as Multi-Family (2-4 Unit). Listing-text estimate: 3 units. confirmed
Listing remarks
Spacious Triplex Opportunity! Live Smart & Invest Wisely in Ellenwood Welcome to this large triplex nestled in a quiet, established neighborhood with no HOA! An ideal opportunity for both savvy investors and owner-occupants seeking additional income. Offering over 3,500 square feet, this property delivers the perfect blend of comfort, functionality, and income potential. Unit 1 (1 Bedroom / 1 Bathroom) Vacant Cozy and inviting, this unit features a bright living space, galley kitchen, Flex Space, and a full bathroom Units 2 & 3 (2 Bedrooms / 2.5 Bathrooms - Vacant) Spacious and thoughtfully designed, each unit includes a fireplace, formal dining area, galley kitchen, and a
Key facts
- 0.45 acre lot
- 6 parking spots
- Built 1986
Property features AI
Finance
- Financial info: Property contains 3 total units
Exterior
- Parking: Carport; Total of 6 parking spaces
- Utilities: Public water; Public sewer; Cable available; Electricity available; Natural gas available; Phone available
- Home design: Two levels; Resale property
- Construction: Brick and wood siding exterior; Composition roof
- Exterior features: Near schools; Near shopping; Street lights
Interior
- Bedrooms: 3-unit property (multi-family) — individual bedroom counts not provided
- Flooring: Carpet; Laminate; Vinyl
- Heating & cooling: Central heating; Central air conditioning
- Interior features: Unfurnished; Carpet, Laminate, and Vinyl flooring
Neighborhood map
What this means for you Summary
Snapshot
- This is a 2×2.0bd/2.5ba + 1×1.0bd/1.0ba units multifamily listed at $460k.
Deal economics
- At list price, monthly cash flow is $638 ($8k/yr) — positive. Per door: $213/mo.
- The deal already cash-flows at list — no discount required.
- To meet the 1% rule (rent ≥ 1% of price), the offer needs to be $438k (4.7% below list).
- Recommended offer: $438k (4.7% below list) — sets the bar for 1% rule.
Location & tenants
- Location reads: area grade D — affects rentability + tenant quality, not the cash-flow math above.
- Clayton County (suburban): math 11% / reading 20% proficiency, ranked #155 of 174 in GA (top 89%) — low school quality limits family demand, transient renter base, plan for 1-2y turnover; 78% free/reduced lunch — lower-income household profile, screen leases tightly.
- Market conditions: Rents rising fast (+4.6%/yr); 244 active listings in the ZIP; solid renter incomes; 865 units permitted in Clayton County in 2024 (448 in 5+ unit buildings).
- At $4,382/mo this rent would consume 66% of the median local household income ($80k/yr) (locally 864% of renters already pay >50% of income on rent) — very limited rent-growth headroom before tenants either downsize or default.
Forward outlook
- Local home prices are declining (-3.0%/yr); year-one equity from $3k of loan paydown is wiped out by about $14k of value loss. Plan a longer hold.
- Clayton County population projected at +29% by 2050 — long-run rental-demand tailwind backs the buy-and-hold thesis.
Negotiation context
- It's been on market 18 days — a 2% lower offer ($453k) is reasonable based on typical stale-listing flexibility.
- 4 sale attempts with the ask held roughly flat each time — persistent listings suggest the price (not the market) is what's stuck; bring a comps-based counter.
- Current owner paid $148k; list at $460k implies a 212% gain — meaningful room to come down on a strong offer.
Risks & watch-outs
- Climate carrying-cost: major wind risk, 27% chance of damaging wind over 30y; extreme-heat days projected 7→18/yr by 2055 (HVAC capex compounding) — expect insurance premiums to compound above CPI over the hold.
Questions for the listing agent
- Can we see the unit-by-unit rent roll, current vacancy, and any below-market leases? What's the average tenancy length?
- What capital expenditures (roof, boiler, parking lot, exteriors) have been made in the last 5 years, and what's planned in the next 2?
- Is there a deadline driving the sale (1031 exchange, divorce, estate, relocation)? That informs how much negotiation room exists.
- The area grade is low — what's the realistic commute time and amenity access for the typical tenant pool here? Any planned neighborhood developments (good or bad) we should know about?
- What's the average days-on-market for RENTAL listings here right now (not sales)? A rising rental-DOM trend means longer vacancies and softer asking-rent achievability than the comps imply.
- What's the recent tenant-quality profile in this submarket — average credit score on applications, eviction rate, late-payment / NSF rate, and stable-employment percentage? A property-management company in the area should have these aggregated.
- How much new apartment / multifamily construction is in the pipeline within 1–3 miles? Heavy new supply (>2% of stock underway) typically softens rents 12–24 months out; light construction supports rent growth.
Investment metrics
- 1% rule
- 0.95% ✗
- Cap rate
- 7.96%
- Cash-on-cash
- 5.94%
- DSCR
- 1.26
- GRM
- 8.7
CMA / ARV
No comps found within radius.
Projected returns pro-forma
-3.0% appreciation · 4.56% rent growth · sell at horizon
- IRR
- -5.6%
- Equity multiple
- 0.79×
- Total profit
- $-27,060
- Equity at exit
- $68,573
- IRR
- 5.7%
- Equity multiple
- 1.45×
- Total profit
- $57,728
- Equity at exit
- $39,764
Cash invested: $128,772 (down + closing). Projections, not guarantees.
Landlord ↔ Tenant lean methodology
- Overall (STATE)
- 90 Strongly Landlord-Friendly
- State Georgia
- 90 Strongly Landlord-Friendly · R+3
- County
- — inherits STATE
- City
- — inherits STATE
ZIP-level market 30294
- Home prices YoY
- -25.0%
- Rents YoY
- 4.6%
- Active inventory
- 244
- Price-to-rent
- 24.2×
Monthly cashflow live
- Estimated rent
- $4,382 high interval (Pro) →
- Mortgage (P&I)
- −$2,412
- Tax from tax record
- −$220 /mo · $2,645/yr
- Insurance
- −$192
- HOA
- −$0
- Vacancy / Maint / Mgmt
- −$920
- Net cashflow
- $638
Break-even live
3-unit breakdown (identical units grouped — click to expand)
| Units | Beds | Baths | Est. rent |
|---|---|---|---|
| 2× units | 2.0 | 2.5 | $3,162 |
| #1 | 2.0 | 2.5 | $1,581 |
| #2 | 2.0 | 2.5 | $1,581 |
| 1× unit | 1.0 | 1 | $1,219 |
| Total (3 units) | $4,382 | ||
UW: 25.0% down · 7.5% · 30yr · 1.5% tax · 5.0% vac · 8.0% maint · 8.0% mgmt
Financing live
Cash to close
- Down payment
- $114,975
- Closing costs
- $13,797
- Reserves months
- —
- Total cash needed
- —
Loan-product check · same deal, 3 products live
Conventional
25% down · 7.5% · 30yr
- Down + closing
- —
- Monthly P&I
- —
- Monthly cashflow
- —
- DSCR
- —
- Eligible?
- —
Personal DTI + credit; lowest rate.
DSCR
20% down · 8.5% · 30yr
- Down + closing
- —
- Monthly P&I
- —
- Monthly cashflow
- —
- DSCR
- —
- Eligible?
- —
No personal income docs; deal must DSCR.
Hard money
10% down · 12.0% · 12mo
- Down + closing
- —
- Monthly P&I
- —
- Monthly cashflow
- —
- DSCR
- —
- Eligible?
- —
Short-term bridge; refi at stabilization.
Listing history 13 events
-
2026-05-08$459,900 Active 1279-char remark
-
2026-05-08$459,900 New 1280-char remark
-
2026-05-01historical $459,900 1279-char remark
-
2026-05-01historical $459,900 1280-char remark
-
2025-07-25historical
-
2025-07-25historical
-
2025-07-02price $575,000
-
2025-07-02price $575,000
-
2025-06-16$594,490 New
-
2025-06-16$594,490 New
-
2005-01-27soldstatus $147,500
-
1998-03-09soldstatus $128,000
-
1987-06-22soldstatus $135,000
ⓘ Source: listings_history table (triggers on properties + properties_extension) + one-shot
backfill from property_details.listing_events for pre-trigger history.
Tax reassessment forecast GA · Resets to sale price
- Current annual tax
- $2,645 · $220/mo
- Projected year-2 tax
- $4,231 · $353/mo
- Expected delta
- +$1,586/yr (+$132/mo · 59.9%)
ⓘ Screening estimate from a state-policy table — verify with the county assessor before closing.
Climate risk First Street
- Flood 1/10 Low FEMA zone X (unshaded) · 0% chance over 30 yrs
- Wildfire 1/10 Low
- Heat 6/10 Major 7 d/yr ≥105°F today · 18 d/yr by 30 yrs out
- Wind 6/10 Major 27% chance of damaging wind over 30 yrs
- Air quality 4/10 Moderate 4 unhealthy d/yr today · 6 by 30 yrs out
Nearby sold comps map
Loading sold comps map…
Walkable amenities ~0.75 mi
Loading nearby amenities…
Taxation est. · year 1
- Rental income
- $52,584
- − Mortgage interest
- −$25,762
- − Property taxes
- −$2,645
- − Insurance
- −$2,300
- − Repairs & maintenance
- −$4,207
- − Management
- −$4,207
- − Depreciation
- −$13,379
- Taxable income
- $85
- Est. tax owed @ 24.0%
- −$20
- After-tax cash flow
- $7,635/yr
For passive investors: Depreciation is non-cash, so a rental often shows a tax loss while cash-flowing — sheltering income. Rental losses are passive: they offset passive income freely, and up to $25,000/yr can offset ordinary (W-2) income if you actively participate and your MAGI is under $100k (phasing out to $0 by $150k); unused losses carry forward. On sale, claimed depreciation is recaptured at up to 25%, and gains may owe capital-gains tax (a 1031 exchange can defer both). Figures are a year-1 estimate at your 24.0% rate — not tax advice; consult a CPA.
Schools (NCES district)
- District
- Clayton County
- NCES district ID
- 1301230
- Math proficiency
- 11% ▼ -13.00%
- Reading proficiency
- 20% ▼ -9.00%
- Median HH income
- $42,266
- Composite
- 13.41/100
- National rank
- #9527
- State rank
- #155 of 174 in GA
Livability — Ellenwood
No livability data for this city. (Only ~50 U.S. cities are tracked.)
Census & demographics
- County
- Henry County · 316,359 people
- City population
- 41,983
- Metro
- Atlanta-Sandy Springs-Alpharetta, GA
- Population (ZIP)
- 41,983
- Household income
- $79,762
- Rent vs Own
- Severe rent burden
- 864.0
Population outlook (Clayton County) Hauer SSP2
- Today (2025)
- 310,777 people
- By 2030
- 329,762 · +6.1%
- By 2040
- 368,052 · +18.4%
- By 2050
- 401,196 · +29.1%
- By 2075
- 472,488 · +52.0%
- By 2100
- 500,446 · +61.0%
Race, ethnicity, and origin ACS 2023
- Neighborhood character
- Predominantly Black (84%)
- Race & ethnicity
- Black 84% Hispanic / Latino 7% Two or more races 6% White 6% Asian 1%
- Hispanic origin (detail)
- Mexican 6%
- Common ancestry
- Hispanic 1%
- Foreign-born
- 7% · Canada, Vietnam
- Languages at home
- 91% English-only · Spanish 6% Vietnamese 1% French/Haitian/Cajun 1%
Political lean MEDSL · Clayton
- 2024 margin
- Solid D (+69.2) · D 84.3% · R 15.1%
- 2008→2024 swing
- +2.8pp toward D · 2008: 66.4pp · 2024: 69.2pp
- All cycles
- 2024: D+69.2 2020: D+70.9 2016: D+71.9 2012: D+70.1 2008: D+66.4
Not yet ingested
- Civics
- —
Market trends
- HPI YoY
- ▼ -70.99%
- Current HPI
- 213.1999
- Rent YoY
- ▲ 4.56%
- Metro
- Atlanta-Sandy Springs-Alpharetta, GA
- State GDP YoY
- ▲ 2.66%
- F500 in state
- 28
Industry mix (Fortune 500 HQ in GA)
| Industry | F500 HQs | Revenue |
|---|---|---|
| Paper / Packaging | 2 | $29B |
|
||
| Retail | 1 | $160B |
|
||
| Transportation / Logistics | 1 | $91B |
|
||
| Airlines | 1 | $62B |
|
||
| Consumer Goods | 1 | $47B |
|
||
| Utilities | 1 | $25B |
|
||
Price history
+240.7% since first listed15 events — show timeline
- 2026-05-26 Listing Removed — GAMLS
- 2026-05-26 Listing Removed — FMLS
- 2026-05-08 Listed $459,900 FMLS
- 2026-05-08 Listed $459,900 GAMLS
- 2026-05-01 Coming Soon — FMLS
- 2026-05-01 Coming Soon — GAMLS
- 2025-07-25 Listing Removed — GAMLS
- 2025-07-25 Listing Removed — GAMLS
- 2025-07-02 Price Changed $575,000 GAMLS
- 2025-07-02 Price Changed $575,000 GAMLS
- 2025-06-16 Listed $594,490 GAMLS
- 2025-06-16 Listed $594,490 GAMLS
- 2005-01-27 Sold (Public Records) $147,500 Public Records
- 1998-03-09 Sold (Public Records) $128,000 Public Records
- 1987-06-22 Sold (Public Records) $135,000 Public Records
Property tax history
-0.3%/yrLatest (2025): $2,645 · +0.2% YoY. Source: county tax records.
Cash-flow waterfall
monthlySold comps — $/sqft
last 12 mo · ≤1 miLoading sold comps…