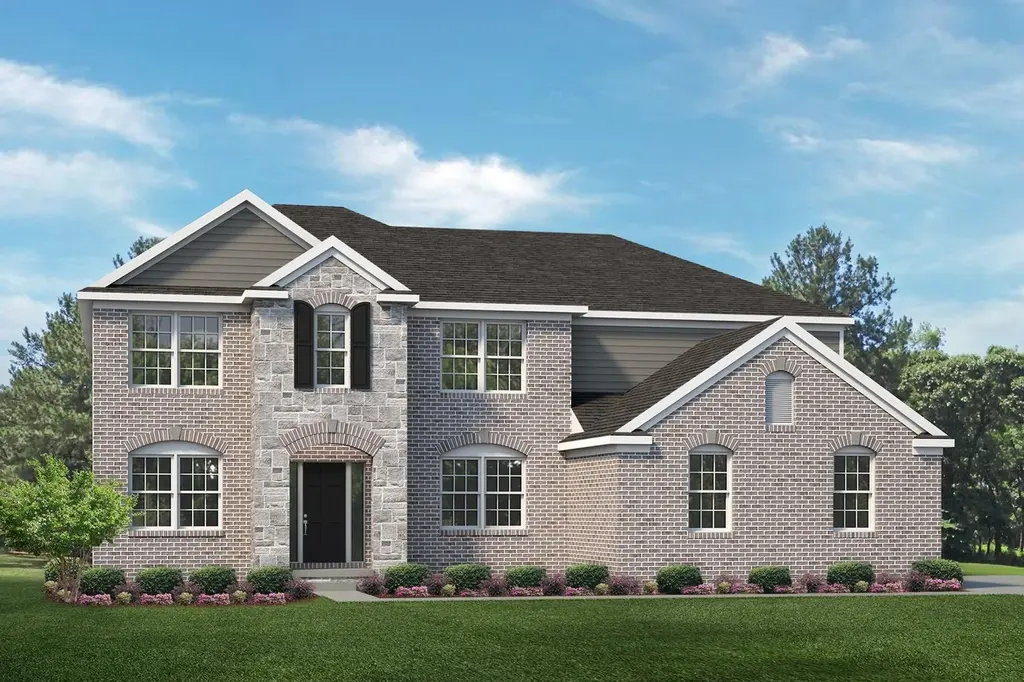
Hampton Plan
Utica, MI 48315
$642,990F
4 bd · 2.5 ba ·
3,116 sqft ·
Built —
· SingleFamily
· Active
· 59 DOM
Cashflow @ list (25.0% down · 7.5%)
Estimated rent
$4,950/mo
Mortgage (P&I)
−$4,587
Tax + insurance
−$1,458
HOA
−$0
Vac / Maint / Mgmt
−$1,040
Net cashflow
$-2,134/mo
Annual
$-25,610/yr
Cap rate
3.36%
Cash-on-cash
-10.46%
DSCR
0.53
1% rule
0.57%
Cash to close
$244,909
Investor read
- This is a 4-bed/2.5-bath single-family listed at $643k.
- At list price, monthly cash flow is $-2k ($-26k/yr) — negative.
- To cash-flow at today's rent, offer at most $566k (12.0% below list).
- To meet the 1% rule (rent ≥ 1% of price), the offer needs to be $495k (23.0% below list).
- It's been on market 59 days — a 3% lower offer ($624k) is reasonable based on typical stale-listing flexibility.
- Recommended offer: $495k (23.0% below list) — sets the bar for 1% rule.
- Local home prices are declining (-3.0%/yr); year-one equity from $6k of loan paydown is wiped out by about $26k of value loss. Plan a longer hold.
- Location reads 78/100 on livability (#106 in MI, #2,586 nationally) — a middle-class / working-renter tenant base. Strengths: commute A+, cost of living A+, housing A+; Watch: crime D+, health & safety D+, employment D.
- Utica Community Schools (suburban): math 38% / reading 53% proficiency, ranked #126 of 540 in MI (top 23%) — families likely to look elsewhere, expect single-tenant / working-renter base with shorter leases.
- Zoned schools: Richard J Duncan Elementary (math 49% / reading 67%, grade C+, #229 of 1,397 statewide, top 17%, 701 students, 29% FRL); Eisenhower High School (math 44% / reading 66%, grade C, #107 of 713 statewide, top 15%, 1,835 students, 21% FRL) — zoned schools at 25% FRL track the district average.
- Market conditions: 233 active listings in the ZIP; 1 comparable units currently listed for rent nearby; 1,321 units permitted in Macomb County in 2024 (86 in 5+ unit buildings).
- Macomb County population projected at +9% by 2050 — modest demand growth; plan on rents tracking national, not racing it.
Questions for listing agent
- What do current leases actually rent for vs. the listed asking? Can we see a recent rent roll and the last 12 months of T-12 income?
- It's been on market 59 days. Have you received any prior offers? Is the seller open to a 23% concession, seller financing, or rate buy-down credit?
- Is there a deadline driving the sale (1031 exchange, divorce, estate, relocation)? That informs how much negotiation room exists.
- Crime grade is D in this area — have there been break-ins, vandalism, or insurance claims at this property in the last 3 years? What carrier currently insures it and at what premium?
- The area grade is low — what's the realistic commute time and amenity access for the typical tenant pool here? Any planned neighborhood developments (good or bad) we should know about?
- What's the average days-on-market for RENTAL listings here right now (not sales)? A rising rental-DOM trend means longer vacancies and softer asking-rent achievability than the comps imply.
- What's the recent tenant-quality profile in this submarket — average credit score on applications, eviction rate, late-payment / NSF rate, and stable-employment percentage? A property-management company in the area should have these aggregated.
- How much new for-sale + rental construction is in the pipeline within 1–3 miles? Heavy new supply typically softens prices + rents 12–24 months out; constrained supply supports both.
CashFlowRE · CFR-2XXN65429NHA9G
· Data 1 day ago
cashflowre.app · 2026-05-29