 🏗️ New Construction
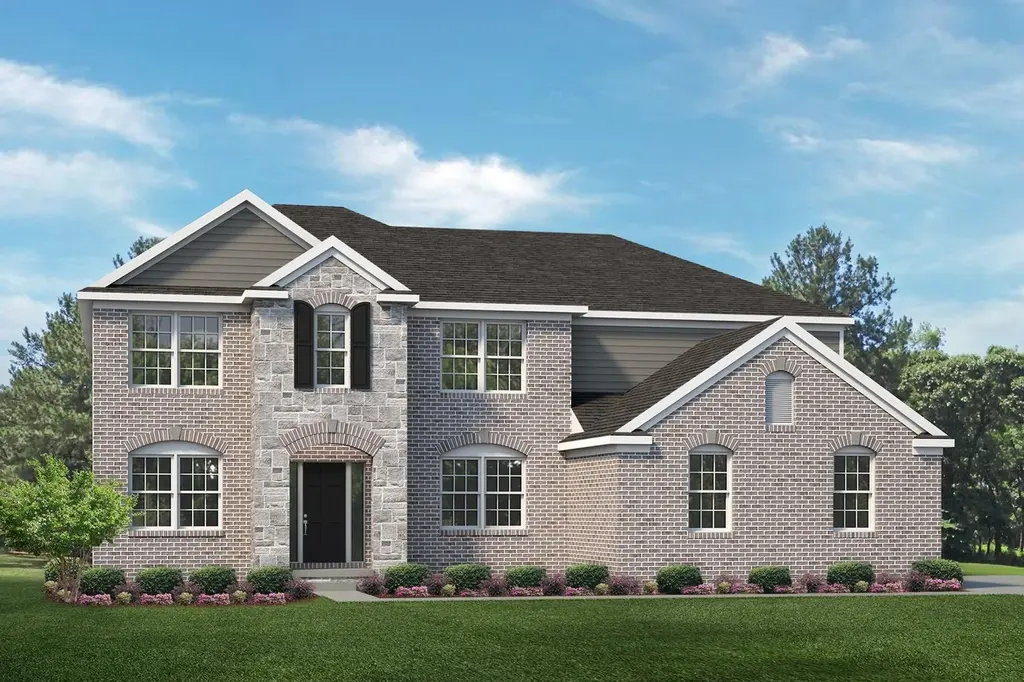
Hampton Plan · Utica, MI
Flood risk 1/10 · Minimal
- FEMA flood zone
- X (unshaded)
- Chance of flooding over 30 yrs
- 0.0%
- Est. flood insurance / yr
- $473 – $860
Fire risk 3/10 · Minor
- Est. fire insurance / yr
- $784 – $1,456
Heat risk 3/10 · Minor
- Hot days now (above 97°F)
- 7 days/yr
- Hot days in 30 yrs
- 15 days/yr
Wind risk 1/10 · Minimal
- Chance of severe wind over 30 yrs
- —
Air-quality risk 3/10 · Minor
- Unhealthy air days now
- 3 days/yr
- Unhealthy air days in 30 yrs
- 3 days/yr
Risk factors via First Street. Map © Google.
Why this score? — see what drove the F grade
The composite is a weighted blend of 9 inputs, each scored 0–100. Each bar is that input's sub-score; the figure is the points it added to the 100-point composite (weight × sub-score).
- ARV discount +7.5/15.0
- Cash flow +4.8/30.0
- Schools +4.1/10.0
- Livability +3.9/5.0
- Rent growth +2.5/5.0
- Condition / age +2.5/5.0
- 1% rule +0.7/10.0
- DSCR +0.0/10.0
- Appreciation +0.0/10.0
$642,990
🖨 Deal sheet (PDF) 📄 Offer letter ✓ Due diligence
Listing remarks
The Hampton is a two-story home with 4 bedrooms, 2.5 bathrooms, and more than 3,100 sq. ft. of living space. The first floor showcases a dining room and study off the foyer, family room that opens to the kitchen and eat-in nook, great room, and a mud room with a walk-in closet. The second floor features a laundry room, primary suite with a full bath and walk in closet, and three secondary bedrooms. Looking for a new home in Southeast Michigan? Contact our sales team to learn more about the Hampton! We can't wait to meet with you and discuss building your dream home with Lombardo Homes! All dimensions are approximate. Drawings and photos are for illustrative purposes only. Information is sub
Key facts
- Study
- Kitchen
- Family room
Tags
Property features AI
Finance
- Other: Address: Utica, MI 48315
- Financial info: Listing status: Active; List price available
Exterior
- Parking: 2-car garage (2 total parking spaces)
- Home design: New construction plan; Hampton plan
- Exterior features: Living area approximately 3116
Interior
- Bedrooms: 4 bedrooms
- Bathrooms: 2 full bathrooms, 1 half bathroom (2.5 total)
- Interior features: Plan: Hampton
Neighborhood map
What this means for you Summary
Snapshot
- This is a 4-bed/2.5-bath single-family listed at $643k.
Deal economics
- At list price, monthly cash flow is $-2k ($-26k/yr) — negative.
- To cash-flow at today's rent, offer at most $566k (12.0% below list).
- To meet the 1% rule (rent ≥ 1% of price), the offer needs to be $495k (23.0% below list).
- Recommended offer: $495k (23.0% below list) — sets the bar for 1% rule.
Location & tenants
- Location reads 78/100 on livability (#106 in MI, #2,586 nationally) — a middle-class / working-renter tenant base. Strengths: commute A+, cost of living A+, housing A+; Watch: crime D+, health & safety D+, employment D.
- Utica Community Schools (suburban): math 38% / reading 53% proficiency, ranked #126 of 540 in MI (top 23%) — families likely to look elsewhere, expect single-tenant / working-renter base with shorter leases.
- Zoned schools: Richard J Duncan Elementary (math 49% / reading 67%, grade C+, #229 of 1,397 statewide, top 17%, 701 students, 29% FRL); Eisenhower High School (math 44% / reading 66%, grade C, #107 of 713 statewide, top 15%, 1,835 students, 21% FRL) — zoned schools at 25% FRL track the district average.
- Market conditions: 233 active listings in the ZIP; 1 comparable units currently listed for rent nearby; 1,321 units permitted in Macomb County in 2024 (86 in 5+ unit buildings).
Forward outlook
- Local home prices are declining (-3.0%/yr); year-one equity from $6k of loan paydown is wiped out by about $26k of value loss. Plan a longer hold.
- Macomb County population projected at +9% by 2050 — modest demand growth; plan on rents tracking national, not racing it.
Negotiation context
- It's been on market 59 days — a 3% lower offer ($624k) is reasonable based on typical stale-listing flexibility.
Questions for the listing agent
- What do current leases actually rent for vs. the listed asking? Can we see a recent rent roll and the last 12 months of T-12 income?
- It's been on market 59 days. Have you received any prior offers? Is the seller open to a 23% concession, seller financing, or rate buy-down credit?
- Is there a deadline driving the sale (1031 exchange, divorce, estate, relocation)? That informs how much negotiation room exists.
- Crime grade is D in this area — have there been break-ins, vandalism, or insurance claims at this property in the last 3 years? What carrier currently insures it and at what premium?
- The area grade is low — what's the realistic commute time and amenity access for the typical tenant pool here? Any planned neighborhood developments (good or bad) we should know about?
- What's the average days-on-market for RENTAL listings here right now (not sales)? A rising rental-DOM trend means longer vacancies and softer asking-rent achievability than the comps imply.
- What's the recent tenant-quality profile in this submarket — average credit score on applications, eviction rate, late-payment / NSF rate, and stable-employment percentage? A property-management company in the area should have these aggregated.
- How much new for-sale + rental construction is in the pipeline within 1–3 miles? Heavy new supply typically softens prices + rents 12–24 months out; constrained supply supports both.
Investment metrics
- 1% rule
- 0.57% ✗
- Cap rate
- 3.36%
- Cash-on-cash
- -10.46%
- DSCR
- 0.53
- GRM
- 14.7
CMA / ARV
- ARV (median comp)
- $874,676
- List price
- $642,990
- Delta
- -26.49%
- Verdict
- UNDERPRICED
- Comps
- 20 within 1.0 mi
Show comp detail 12 sales within ~0.75 mi
| Address | Dist | Beds/Ba | Sqft | Sold | Price | $/sf | Match |
|---|---|---|---|---|---|---|---|
| 57165 Willow Ridge Blvd | 0.14mi | 4/3.5 | 3,005 (-4%) | 4mo | $590,500 | $197 | 80 |
| 57116 Veridian Dr. Dr | 0.12mi | 4/3.5 | 3,250 (+4%) | 4mo | $855,000 | $263 | 80 |
| 13914 Leeward Dr | 0.60mi | 4/2.5 | 3,149 (+1%) | 1mo | $886,554 | $282 | 70 |
| 57611 Hawthorn Dr | 0.47mi | 4/3.5 | 3,050 (-2%) | 9mo | $549,000 | $180 | 63 |
| 14103 Regatta Bay Dr | 0.37mi | 3/2.5 (-1) | 2,839 (-9%) | 1mo | $824,171 | $290 | 62 |
| 55895 Laurel Oaks Ln #1 | 0.66mi | 4/3.5 | 3,148 (+1%) | 9mo | $797,368 | $253 | 56 |
| 55895 Laurel Oaks Ln | 0.66mi | 4/3.5 | 3,148 (+1%) | 9mo | $797,368 | $253 | 56 |
| 56159 Sailmast Ln | 0.41mi | 4/2.5 | 3,546 (+14%) | 2mo | $781,708 | $220 | 56 |
| 56259 Schoenherr Rd | 0.66mi | 4/2.5 | 2,796 (-10%) | 9mo | $717,500 | $257 | 45 |
| 55641 Laurel Oaks Ln #8 | 0.75mi | 4/2.5 | 2,834 (-9%) | 6mo | $715,656 | $253 | 45 |
| 55641 Laurel Oaks Ln | 0.75mi | 4/2.5 | 2,834 (-9%) | 6mo | $715,656 | $253 | 45 |
| 57563 Stonebriar Dr | 0.63mi | 3/2.5 (-1) | 2,687 (-14%) | 1mo | $609,000 | $227 | 42 |
Match score weights: distance 35% · size 25% · config 20% · recency 20%. Top-matched comps best support the ARV.
Projected returns pro-forma
-3.0% appreciation · 3.0% rent growth · sell at horizon
- IRR
- -35.2%
- Equity multiple
- -0.13×
- Total profit
- $-277,588
- Equity at exit
- $130,417
- IRR
- -46.6%
- Equity multiple
- -0.70×
- Total profit
- $-416,444
- Equity at exit
- $75,626
Cash invested: $244,909 (down + closing). Projections, not guarantees.
Landlord ↔ Tenant lean methodology
- Overall (STATE)
- 62 Landlord-Friendly
- State Michigan
- 62 Landlord-Friendly · EVEN
- County
- — inherits STATE
- City
- — inherits STATE
ZIP-level market 48315
- Active inventory
- 233
- Price-to-rent
- 10.8×
Monthly cashflow live
- Estimated rent
- $4,950 medium interval (Pro) →
- Mortgage (P&I)
- −$4,587
- Tax est. 1.5%
- −$1,093 /mo · $13,120/yr
- Insurance
- −$364
- HOA
- −$0
- Vacancy / Maint / Mgmt
- −$1,040
- Net cashflow
- $-2,134
Break-even live
Sensitivity live
| Price | -10% $-1,530 | -5% $-1,832 | +0% $-2,134 | +5% $-2,436 | +10% $-2,739 |
|---|---|---|---|---|---|
| Rent | -10% $-2,525 | -5% $-2,330 | +0% $-2,134 | +5% $-1,939 | +10% $-1,743 |
| Rate | -1.0pp $-1,694 | -0.5pp $-1,912 | base $-2,134 | +0.5pp $-2,361 | +1.0pp $-2,591 |
UW: 25.0% down · 7.5% · 30yr · 1.5% tax · 5.0% vac · 8.0% maint · 8.0% mgmt
Financing live
Cash to close
- Down payment
- $218,669
- Closing costs
- $26,240
- Reserves months
- —
- Total cash needed
- —
Loan-product check · same deal, 3 products live
Conventional
25% down · 7.5% · 30yr
- Down + closing
- —
- Monthly P&I
- —
- Monthly cashflow
- —
- DSCR
- —
- Eligible?
- —
Personal DTI + credit; lowest rate.
DSCR
20% down · 8.5% · 30yr
- Down + closing
- —
- Monthly P&I
- —
- Monthly cashflow
- —
- DSCR
- —
- Eligible?
- —
No personal income docs; deal must DSCR.
Hard money
10% down · 12.0% · 12mo
- Down + closing
- —
- Monthly P&I
- —
- Monthly cashflow
- —
- DSCR
- —
- Eligible?
- —
Short-term bridge; refi at stabilization.
Rent comps 1 comps
| Address | Beds | Baths | Sqft | Rent | $/sqft | DOM | Units | Dist |
|---|---|---|---|---|---|---|---|---|
| 55740 Beacon Shore Dr Utica, MI | 5.0 | 4.0 | 3385 | $4,950 | $1.46 | 3d | 1 | 1.01mi |
Listing history 16 events
-
2026-06-21days on market $642,990 Active 59 DOM
-
2026-06-18days on market $642,990 Active 56 DOM
-
2026-06-17days on market $642,990 Active 55 DOM
-
2026-06-16days on market $642,990 Active 54 DOM
-
2026-06-15days on market $642,990 Active 53 DOM
-
2026-06-13days on market $642,990 Active 51 DOM
-
2026-06-13days on market $642,990 Active 50 DOM
-
2026-06-09days on market $642,990 Active 47 DOM
-
2026-06-08days on market $642,990 Active 46 DOM
-
2026-06-07days on market $642,990 Active 45 DOM
-
2026-06-04days on market $642,990 Active 42 DOM
-
2026-06-03days on market $642,990 Active 41 DOM
-
2026-06-02days on market $642,990 Active 40 DOM
-
2026-06-01days on market $642,990 Active 39 DOM
-
2026-05-31days on market $642,990 Active 38 DOM
-
2026-04-23$642,990 Active 1164-char remark
ⓘ Source: listings_history table (triggers on properties + properties_extension) + one-shot
backfill from property_details.listing_events for pre-trigger history.
Climate risk First Street
- Flood 1/10 Low FEMA zone X (unshaded) · 0% chance over 30 yrs
- Wildfire 3/10 Moderate
- Heat 3/10 Moderate 7 d/yr ≥97°F today · 15 d/yr by 30 yrs out
- Wind 1/10 Low
- Air quality 3/10 Moderate 3 unhealthy d/yr today · 3 by 30 yrs out
Nearby sold comps map
Loading sold comps map…
Walkable amenities ~0.75 mi
Loading nearby amenities…
Taxation est. · year 1
- Rental income
- $59,400
- − Mortgage interest
- −$48,995
- − Property taxes
- −$13,120
- − Insurance
- −$4,373
- − Repairs & maintenance
- −$4,752
- − Management
- −$4,752
- − Depreciation
- −$25,445
- Taxable loss
- −$42,038
- Est. tax savings @ 24.0%
- +$10,089
- After-tax cash flow
- $-15,521/yr
For passive investors: Depreciation is non-cash, so a rental often shows a tax loss while cash-flowing — sheltering income. Rental losses are passive: they offset passive income freely, and up to $25,000/yr can offset ordinary (W-2) income if you actively participate and your MAGI is under $100k (phasing out to $0 by $150k); unused losses carry forward. On sale, claimed depreciation is recaptured at up to 25%, and gains may owe capital-gains tax (a 1031 exchange can defer both). Figures are a year-1 estimate at your 24.0% rate — not tax advice; consult a CPA.
Schools (NCES district)
- District
- Utica Community Schools
- NCES district ID
- 2634470
- Math proficiency
- 38% ▼ -13.00%
- Reading proficiency
- 53% ▼ -7.00%
- Median HH income
- $65,953
- Composite
- 40.52/100
- National rank
- #3709
- State rank
- #126 of 540 in MI
Livability — Utica
- Score
- 78/100
- State rank
- #106
- US rank
- #2586
Category grades
Schools grade is shown separately in the Schools card above.
Census & demographics
- Population (ZIP)
- 28,428
Population outlook (Macomb County) Hauer SSP2
- Today (2025)
- 925,296 people
- By 2030
- 948,226 · +2.5%
- By 2040
- 983,961 · +6.3%
- By 2050
- 1,010,200 · +9.2%
- By 2075
- 1,076,222 · +16.3%
- By 2100
- 1,077,065 · +16.4%
Race, ethnicity, and origin ACS 2023
- Neighborhood character
- Predominantly White (86%)
- Race & ethnicity
- White 86% Two or more races 4% Asian 4% Hispanic / Latino 3% Black 3%
- Common ancestry
- Romanian 11% Lithuanian 4% Italian 2%
- Foreign-born
- 14% · Canada, South Korea, China
- Languages at home
- 81% English-only · Other Indo-European 9% Arabic 4% Spanish 2%
Political lean MEDSL · Macomb
- 2024 margin
- R (+13.7) · D 42.2% · R 55.9% · Other 1.9%
- 2008→2024 swing
- -22.3pp toward R · 2008: 8.6pp · 2024: -13.7pp
- All cycles
- 2024: R+13.7 2020: R+8.1 2016: R+11.6 2012: D+4.0 2008: D+8.6
Not yet ingested
- Civics
- —
Market trends
- HPI YoY
- ▼ -173.36%
- Current HPI
- 194.9368
- Rent YoY
- —
- Metro
- —
- State GDP YoY
- ▲ 1.37%
- F500 in state
- 28
Industry mix (Fortune 500 HQ in MI)
| Industry | F500 HQs | Revenue |
|---|---|---|
| Automotive Parts | 3 | $48B |
|
||
| Automotive | 2 | $372B |
|
||
| Chemicals | 1 | $45B |
|
||
| Automotive Retail | 1 | $29B |
|
||
| Healthcare / Medical Devices | 1 | $23B |
|
||
| Automotive Technology | 1 | $20B |
|
||
Cash-flow waterfall
monthlySold comps — $/sqft
last 12 mo · ≤1 miLoading sold comps…