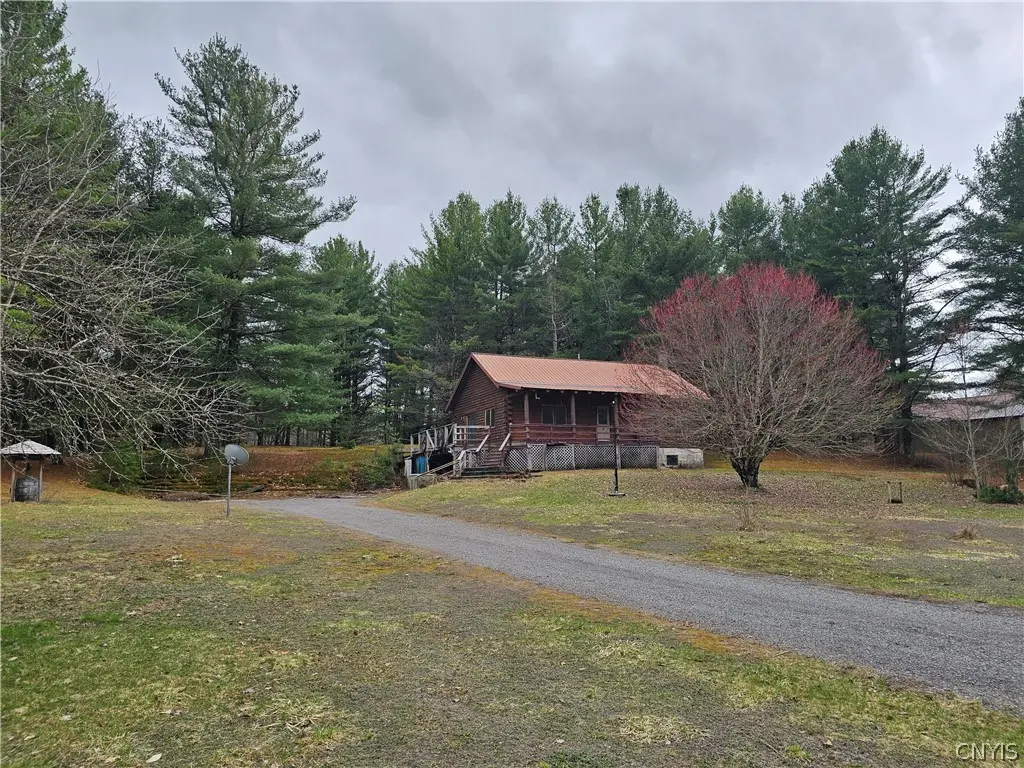
7746 Number Four Rd
Croghan, NY 13367
$179,900D
2 bd · 1.0 ba ·
1,218 sqft ·
Built 1992
· SingleFamily
· Active
· 7 DOM
Cashflow @ list (25.0% down · 7.5%)
Estimated rent
$1,053/mo
Mortgage (P&I)
−$943
Tax + insurance
−$369
HOA
−$0
Vac / Maint / Mgmt
−$221
Net cashflow
$-481/mo
Annual
$-5,772/yr
Cap rate
3.08%
Cash-on-cash
-11.46%
DSCR
0.49
1% rule
0.59%
Cash to close
$50,372
Investor read
- This is a 2-bed/1.0-bath single-family listed at $180k.
- At list price, monthly cash flow is $-481 ($-6k/yr) — negative.
- To cash-flow at today's rent, offer at most $95k (47.2% below list).
- To meet the 1% rule (rent ≥ 1% of price), the offer needs to be $105k (41.5% below list).
- Only 7 days on market — expect competitive offers; lowballing is unlikely to land.
- Recommended offer: $95k (47.2% below list) — sets the bar for cash-flow.
- In year one you build about $19k of equity ($1k loan paydown + $18k appreciation (10.0% local appreciation)).
- Location reads 60/100 on livability (#975 in NY) — a middle-class / working-renter tenant base. Strengths: cost of living A+, housing A+; Watch: health & safety D, crime F, amenities F.
- Beaver River Central School District (rural): math 38% / reading 53% proficiency, ranked #458 of 590 in NY (top 78%) — families likely to look elsewhere, expect single-tenant / working-renter base with shorter leases.
- Zoned schools: Beaver River Elementary School (math 27% / reading 37%, grade F, #1,646 of 2,108 statewide, top 80%, 413 students, 47% FRL); Beaver River Middle School (math 22% / reading 52%, grade F, #448 of 729 statewide, top 63%, 192 students, 53% FRL); Beaver River Senior High School (math 98% / reading 92%, grade A+, #93 of 1,100 statewide, top 10%, 266 students, 48% FRL) — zoned schools average 49% FRL vs 30% district-wide (19 pts higher); higher-poverty schools than district average — tighter screening recommended.
- Market conditions: 46 active listings in the ZIP; 110 units permitted in Lewis County in 2024 (0 in 5+ unit buildings).
- Lewis County population projected at -20% by 2050 — secular population decline; favor cash flow + early exit over multi-decade hold.
- 4 sale attempts with the ask held roughly flat each time — persistent listings suggest the price (not the market) is what's stuck; bring a comps-based counter.
- By year 2, paydown + projected appreciation supports a ~$31k cash-out refi (75% LTV) — recoverable capital for the next deal without selling this one.
Questions for listing agent
- What do current leases actually rent for vs. the listed asking? Can we see a recent rent roll and the last 12 months of T-12 income?
- Is there a deadline driving the sale (1031 exchange, divorce, estate, relocation)? That informs how much negotiation room exists.
- Schools are F-rated, which usually means shorter tenancies and higher turnover. Who's the typical renter profile here, and what's been the actual vacancy rate?
- Crime grade is F in this area — have there been break-ins, vandalism, or insurance claims at this property in the last 3 years? What carrier currently insures it and at what premium?
- The area grade is low — what's the realistic commute time and amenity access for the typical tenant pool here? Any planned neighborhood developments (good or bad) we should know about?
- What's the average days-on-market for RENTAL listings here right now (not sales)? A rising rental-DOM trend means longer vacancies and softer asking-rent achievability than the comps imply.
- What's the recent tenant-quality profile in this submarket — average credit score on applications, eviction rate, late-payment / NSF rate, and stable-employment percentage? A property-management company in the area should have these aggregated.
- How much new for-sale + rental construction is in the pipeline within 1–3 miles? Heavy new supply typically softens prices + rents 12–24 months out; constrained supply supports both.
CashFlowRE · CFR-2YQB6BCY2BFC0G
· Data 3 h ago
cashflowre.app · 2026-05-29