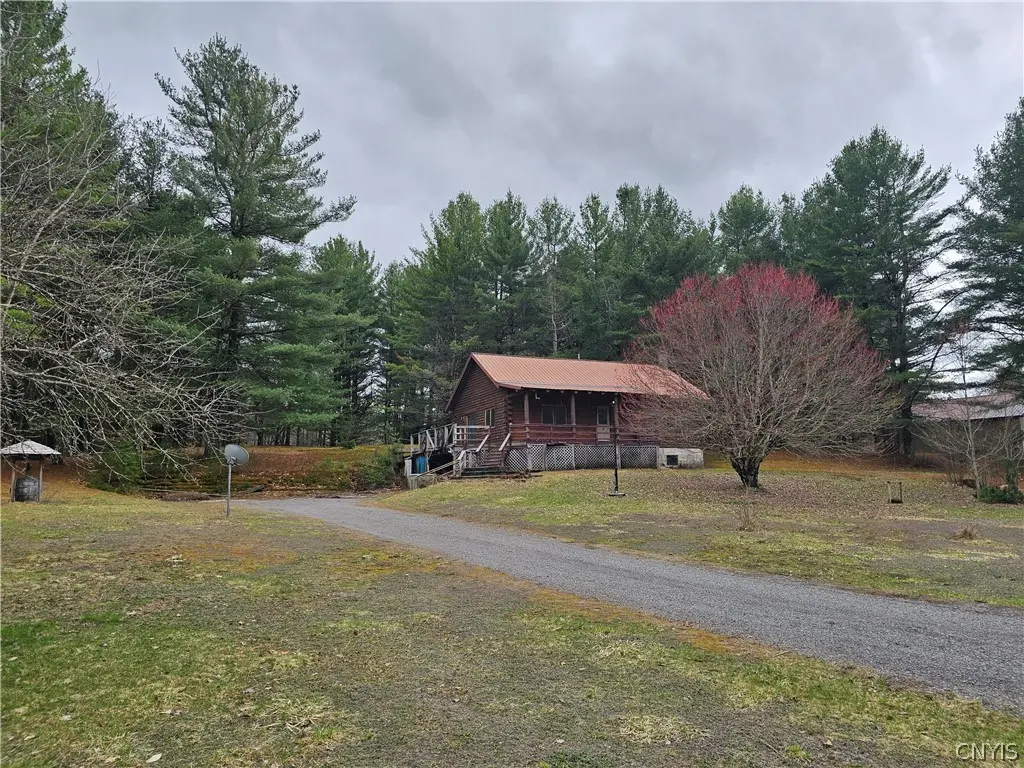
7746 Number Four Rd · Croghan, NY
Flood risk 1/10 · Minimal
- FEMA flood zone
- X
- Chance of flooding over 30 yrs
- 0.0%
- Est. flood insurance / yr
- $473 – $860
Fire risk 3/10 · Minor
- Est. fire insurance / yr
- $691 – $1,283
Heat risk 1/10 · Minimal
- Hot days now (above 89°F)
- 7 days/yr
- Hot days in 30 yrs
- 16 days/yr
Wind risk 1/10 · Minimal
- Chance of severe wind over 30 yrs
- —
Air-quality risk 1/10 · Minimal
- Unhealthy air days now
- 0 days/yr
- Unhealthy air days in 30 yrs
- 0 days/yr
Risk factors via First Street. Map © Google.
Why this score? — see what drove the D grade
The composite is a weighted blend of 9 inputs, each scored 0–100. Each bar is that input's sub-score; the figure is the points it added to the 100-point composite (weight × sub-score).
- ARV discount +15.0/15.0
- Appreciation +10.0/10.0
- Cash flow +4.3/30.0
- Schools +3.9/10.0
- Livability +3.0/5.0
- Rent growth +2.5/5.0
- Condition / age +2.5/5.0
- 1% rule +0.9/10.0
- DSCR +0.0/10.0
$179,900
🖨 Deal sheet (PDF) 📄 Offer letter ✓ Due diligence
Listing remarks
Come check out this steal of a deal on this handyman special 2-bedroom log cabin in great structural condition! This beauty has so much potential and just needs some cosmetic updates! Built on a solid poured concrete foundation, this cozy cabin could make an amazing home or a 4-season recreational getaway tucked away on the edge of the ADK with access to some of the best snowmobiling and ATV trails around! Nice open floorplan with an awesome great room! Views from the deck and covered porch! Garage under home PLUS tons of storage in the rest of the basement and 1/2 bath, could make more finished space/den/rec room/gym etc. !! Beautiful, wooded lot with the Crystal Creek flowing through it!
Key facts
- Covered porch
- Wooded lot
- Great room
Tags
Property features AI
Exterior
- Parking: Attached underground garage; 1 garage space
- Utilities: Well water; Septic system
- Home design: Single-story home; Log construction; Resale property
- Construction: Log construction; Block foundation; Existing (previously built)
- Exterior features: Gravel driveway; River/stream access to Crystal Creek; 100 ft. frontage
Interior
- Kitchen: Dishwasher; Electric cooktop; Refrigerator; Electric water heater
- Bedrooms: Two main-level bedrooms
- Flooring: Carpet; Laminate; Vinyl; Varied flooring
- Bathrooms: One full bathroom; One half bathroom; One main-level bathroom
- Heating & cooling: Oil heating; Baseboard heat
- Interior features: Kitchen and family room combined; Full basement
Neighborhood map
What this means for you Summary
Snapshot
- This is a 2-bed/1.0-bath single-family listed at $180k.
Deal economics
- At list price, monthly cash flow is $-481 ($-6k/yr) — negative.
- To cash-flow at today's rent, offer at most $95k (47.2% below list).
- To meet the 1% rule (rent ≥ 1% of price), the offer needs to be $105k (41.5% below list).
- Recommended offer: $95k (47.2% below list) — sets the bar for cash-flow.
Location & tenants
- Location reads 60/100 on livability (#975 in NY) — a middle-class / working-renter tenant base. Strengths: cost of living A+, housing A+; Watch: health & safety D, crime F, amenities F.
- Beaver River Central School District (rural): math 38% / reading 53% proficiency, ranked #458 of 590 in NY (top 78%) — families likely to look elsewhere, expect single-tenant / working-renter base with shorter leases.
- Zoned schools: Beaver River Elementary School (math 27% / reading 37%, grade F, #1,646 of 2,108 statewide, top 80%, 413 students, 47% FRL); Beaver River Middle School (math 22% / reading 52%, grade F, #448 of 729 statewide, top 63%, 192 students, 53% FRL); Beaver River Senior High School (math 98% / reading 92%, grade A+, #93 of 1,100 statewide, top 10%, 266 students, 48% FRL) — zoned schools average 49% FRL vs 30% district-wide (19 pts higher); higher-poverty schools than district average — tighter screening recommended.
- Market conditions: 46 active listings in the ZIP; 110 units permitted in Lewis County in 2024 (0 in 5+ unit buildings).
Forward outlook
- In year one you build about $19k of equity ($1k loan paydown + $18k appreciation (10.0% local appreciation)).
- Lewis County population projected at -20% by 2050 — secular population decline; favor cash flow + early exit over multi-decade hold.
- By year 2, paydown + projected appreciation supports a ~$31k cash-out refi (75% LTV) — recoverable capital for the next deal without selling this one.
Negotiation context
- Only 7 days on market — expect competitive offers; lowballing is unlikely to land.
- 4 sale attempts with the ask held roughly flat each time — persistent listings suggest the price (not the market) is what's stuck; bring a comps-based counter.
Questions for the listing agent
- What do current leases actually rent for vs. the listed asking? Can we see a recent rent roll and the last 12 months of T-12 income?
- Is there a deadline driving the sale (1031 exchange, divorce, estate, relocation)? That informs how much negotiation room exists.
- Schools are F-rated, which usually means shorter tenancies and higher turnover. Who's the typical renter profile here, and what's been the actual vacancy rate?
- Crime grade is F in this area — have there been break-ins, vandalism, or insurance claims at this property in the last 3 years? What carrier currently insures it and at what premium?
- The area grade is low — what's the realistic commute time and amenity access for the typical tenant pool here? Any planned neighborhood developments (good or bad) we should know about?
- What's the average days-on-market for RENTAL listings here right now (not sales)? A rising rental-DOM trend means longer vacancies and softer asking-rent achievability than the comps imply.
- What's the recent tenant-quality profile in this submarket — average credit score on applications, eviction rate, late-payment / NSF rate, and stable-employment percentage? A property-management company in the area should have these aggregated.
- How much new for-sale + rental construction is in the pipeline within 1–3 miles? Heavy new supply typically softens prices + rents 12–24 months out; constrained supply supports both.
Investment metrics
- 1% rule
- 0.59% ✗
- Cap rate
- 3.08%
- Cash-on-cash
- -11.46%
- DSCR
- 0.49
- GRM
- 14.2
CMA / ARV
- ARV (median comp)
- $293,635
- List price
- $179,900
- Delta
- -33.59%
- Verdict
- UNDERPRICED
- Comps
- 1 within 2.0 mi
Projected returns pro-forma
10.0% appreciation · 3.0% rent growth · sell at horizon
- IRR
- 16.3%
- Equity multiple
- 2.34×
- Total profit
- $67,402
- Equity at exit
- $162,068
- IRR
- 15.6%
- Equity multiple
- 5.42×
- Total profit
- $222,696
- Equity at exit
- $349,506
Cash invested: $50,372 (down + closing). Projections, not guarantees.
Landlord ↔ Tenant lean methodology
- Overall (STATE)
- 15 Strongly Tenant-Friendly
- State New York
- 15 Strongly Tenant-Friendly · D+10
- County
- — inherits STATE
- City
- — inherits STATE
ZIP-level market 13367
- Home prices YoY
- 20.2%
- Active inventory
- 46
- Price-to-rent
- 14.2×
Monthly cashflow live
- Estimated rent
- $1,053 medium interval (Pro) →
- Mortgage (P&I)
- −$943
- Tax from tax record
- −$294 /mo · $3,533/yr
- Insurance
- −$75
- HOA
- −$0
- Vacancy / Maint / Mgmt
- −$221
- Net cashflow
- $-481
Break-even live
Sensitivity live
| Price | -10% $-379 | -5% $-430 | +0% $-481 | +5% $-532 | +10% $-583 |
|---|---|---|---|---|---|
| Rent | -10% $-564 | -5% $-523 | +0% $-481 | +5% $-439 | +10% $-398 |
| Rate | -1.0pp $-390 | -0.5pp $-435 | base $-481 | +0.5pp $-528 | +1.0pp $-575 |
UW: 25.0% down · 7.5% · 30yr · 1.5% tax · 5.0% vac · 8.0% maint · 8.0% mgmt
Financing live
Cash to close
- Down payment
- $44,975
- Closing costs
- $5,397
- Reserves months
- —
- Total cash needed
- —
Loan-product check · same deal, 3 products live
Conventional
25% down · 7.5% · 30yr
- Down + closing
- —
- Monthly P&I
- —
- Monthly cashflow
- —
- DSCR
- —
- Eligible?
- —
Personal DTI + credit; lowest rate.
DSCR
20% down · 8.5% · 30yr
- Down + closing
- —
- Monthly P&I
- —
- Monthly cashflow
- —
- DSCR
- —
- Eligible?
- —
No personal income docs; deal must DSCR.
Hard money
10% down · 12.0% · 12mo
- Down + closing
- —
- Monthly P&I
- —
- Monthly cashflow
- —
- DSCR
- —
- Eligible?
- —
Short-term bridge; refi at stabilization.
Listing history 14 events
-
2026-06-22days on market $179,900 Active 7 DOM
-
2026-06-21days on market $179,900 Active 6 DOM
-
2026-06-19days on market $179,900 Active 4 DOM
-
2026-06-18days on market $179,900 Active 3 DOM
-
2026-06-17days on market $179,900 Active 2 DOM
-
2026-06-16remarks 699-char remark
-
2026-06-16pricedays on market $179,900 Active 1 DOM
-
2026-05-04price $195,000 702-char remark
-
2026-02-16status Active 702-char remark
-
2026-02-12historical Active Under Contract 702-char remark
-
2025-12-10price $229,000 702-char remark
-
2025-12-03status Active 702-char remark
-
2025-11-26historical Active Under Contract 702-char remark
-
2025-11-21$239,000 Active 702-char remark
ⓘ Source: listings_history table (triggers on properties + properties_extension) + one-shot
backfill from property_details.listing_events for pre-trigger history.
Tax reassessment forecast NY · Partial reset (capped growth)
- Current annual tax
- $3,533 · $294/mo
- Projected year-2 tax
- $3,533 · $294/mo
- Expected delta
- $0/yr ($0/mo · 0.0%)
ⓘ Screening estimate from a state-policy table — verify with the county assessor before closing.
Climate risk First Street
- Flood 1/10 Low FEMA zone X · 0% chance over 30 yrs
- Wildfire 3/10 Moderate
- Heat 1/10 Low 7 d/yr ≥89°F today · 16 d/yr by 30 yrs out
- Wind 1/10 Low
- Air quality 1/10 Low 0 unhealthy d/yr today · 0 by 30 yrs out
Nearby sold comps map
Loading sold comps map…
Walkable amenities ~0.75 mi
Loading nearby amenities…
Taxation est. · year 1
- Rental income
- $12,635
- − Mortgage interest
- −$10,077
- − Property taxes
- −$3,533
- − Insurance
- −$900
- − Repairs & maintenance
- −$1,011
- − Management
- −$1,011
- − Depreciation
- −$5,233
- Taxable loss
- −$9,130
- Est. tax savings @ 24.0%
- +$2,191
- After-tax cash flow
- $-3,581/yr
For passive investors: Depreciation is non-cash, so a rental often shows a tax loss while cash-flowing — sheltering income. Rental losses are passive: they offset passive income freely, and up to $25,000/yr can offset ordinary (W-2) income if you actively participate and your MAGI is under $100k (phasing out to $0 by $150k); unused losses carry forward. On sale, claimed depreciation is recaptured at up to 25%, and gains may owe capital-gains tax (a 1031 exchange can defer both). Figures are a year-1 estimate at your 24.0% rate — not tax advice; consult a CPA.
Schools (NCES district)
- District
- Beaver River Central School District
- NCES district ID
- 3604200
- Math proficiency
- 38% ▼ -7.00%
- Reading proficiency
- 53% ▲ 1.00%
- Median HH income
- $46,542
- Composite
- 38.67/100
- National rank
- #4147
- State rank
- #458 of 590 in NY
Livability — Croghan
- Score
- 60/100
- State rank
- #975
- US rank
- #19036
Category grades
Schools grade is shown separately in the Schools card above.
Census & demographics
- Population (ZIP)
- 8,786
Population outlook (Lewis County) Hauer SSP2
- Today (2025)
- 26,126 people
- By 2030
- 25,354 · -3.0%
- By 2040
- 23,359 · -10.6%
- By 2050
- 20,927 · -19.9%
- By 2075
- 15,533 · -40.5%
- By 2100
- 10,215 · -60.9%
Race, ethnicity, and origin ACS 2023
- Neighborhood character
- Predominantly White (91%)
- Race & ethnicity
- White 91% Two or more races 5% Hispanic / Latino 4% Black 1%
- Common ancestry
- Lithuanian 9% Romanian 5% Iranian 2%
- Foreign-born
- 2% · Canada
- Languages at home
- 96% English-only · Spanish 3%
Political lean MEDSL · Lewis
- 2024 margin
- Solid R (+44.4) · D 27.8% · R 72.2%
- 2008→2024 swing
- -35.6pp toward R · 2008: -8.8pp · 2024: -44.4pp
- All cycles
- 2024: R+44.4 2020: R+39.2 2016: R+39.6 2012: R+8.7 2008: R+8.8
Not yet ingested
- Civics
- —
Market trends
- HPI YoY
- ▲ 49.81%
- Current HPI
- 296.4815
- Rent YoY
- —
- Metro
- —
- State GDP YoY
- ▲ 2.60%
- F500 in state
- 92
Industry mix (Fortune 500 HQ in NY)
| Industry | F500 HQs | Revenue |
|---|---|---|
| Financial Services | 10 | $950B |
|
||
| Consumer Goods | 9 | $162B |
|
||
| Insurance | 4 | $225B |
|
||
| Telecommunications | 2 | $144B |
|
||
| Pharmaceuticals | 2 | $112B |
|
||
| Media / Entertainment | 2 | $69B |
|
||
Price history
-24.7% since first listed11 events — show timeline
- 2026-06-15 Listed $179,900 CNYIS
- 2026-05-31 Listing Removed — CNYIS
- 2026-05-30 Listing Removed — CNYIS
- 2026-05-29 Listing Removed — CNYIS
- 2026-05-04 Price Changed $195,000 CNYIS
- 2026-02-16 Relisted — CNYIS
- 2026-02-12 Contingent — CNYIS
- 2025-12-10 Price Changed $229,000 CNYIS
- 2025-12-03 Relisted — CNYIS
- 2025-11-26 Contingent — CNYIS
- 2025-11-21 Listed $239,000 CNYIS
Property tax history
+5.0%/yrLatest (2025): $3,533 · +0.9% YoY. Source: county tax records.
Cash-flow waterfall
monthlySold comps — $/sqft
last 12 mo · ≤1 miLoading sold comps…