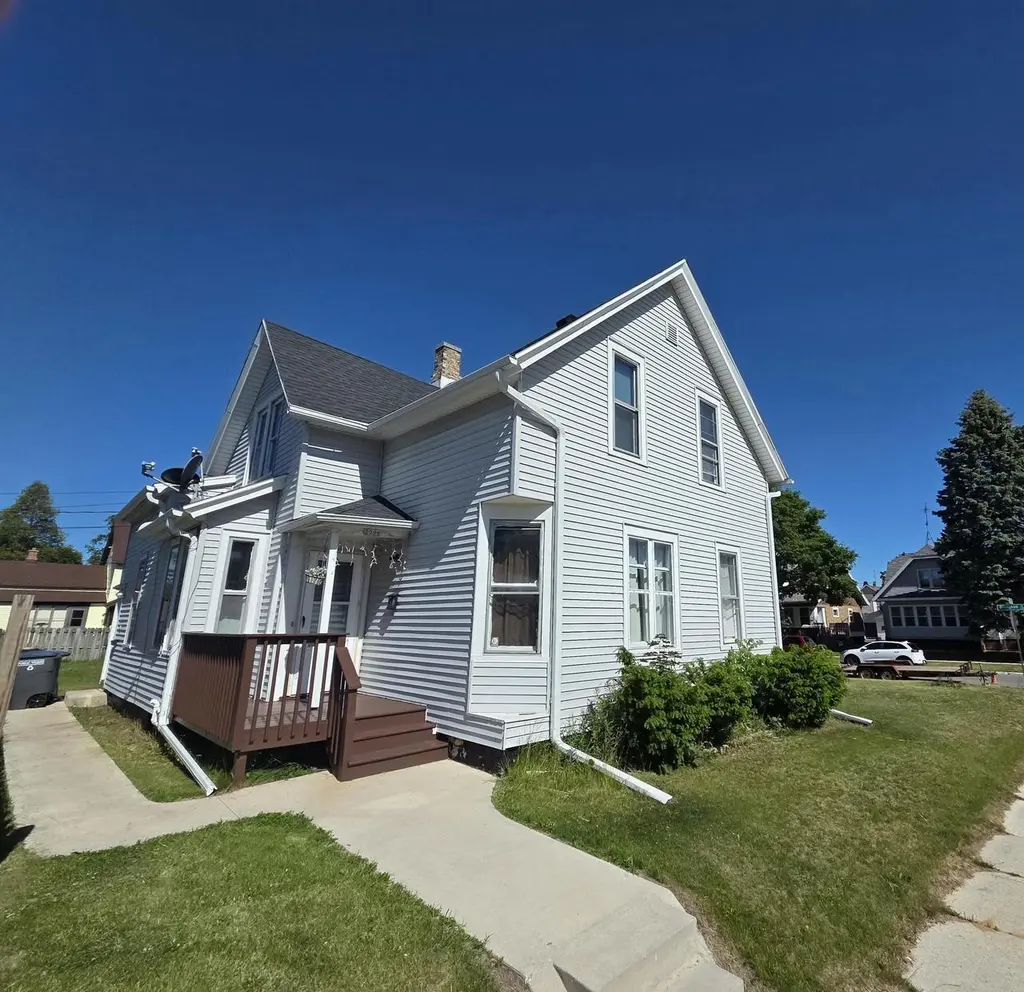
2006 S 11th St #2008
Sheboygan, WI 53081
$229,999D-
4 bd · 2.0 ba ·
1,466 sqft ·
Built 1890
· MultiFamily
· Active
· 3 DOM
Cashflow @ list (25.0% down · 7.5%)
Estimated rent
$2,002/mo
Mortgage (P&I)
−$1,206
Tax + insurance
−$383
HOA
−$0
Vac / Maint / Mgmt
−$420
Net cashflow
$-8/mo
Annual
$-95/yr
Cap rate
6.25%
Cash-on-cash
-0.15%
DSCR
0.99
1% rule
0.87%
Cash to close
$64,400
Investor read
- This is a 2 × 2-bed/1.0-bath units multifamily listed at $230k. Condition is rated good.
- At list price, monthly cash flow is $-8 ($-95/yr) — negative. Per door: $-4/mo.
- To cash-flow at today's rent, offer at most $229k (0.5% below list).
- To meet the 1% rule (rent ≥ 1% of price), the offer needs to be $200k (13.0% below list).
- Only 3 days on market — expect competitive offers; lowballing is unlikely to land.
- Recommended offer: $200k (13.0% below list) — sets the bar for 1% rule.
- Local home prices are declining (-3.0%/yr); year-one equity from $2k of loan paydown is wiped out by about $7k of value loss. Plan a longer hold.
- Location reads 77/100 on livability (#117 in WI, #3,019 nationally) — a middle-class / working-renter tenant base. Strengths: cost of living A+, housing A+, health & safety A+; Watch: crime C-, employment C-, schools D+.
- Sheboygan Area School District (urban): math 28% / reading 31% proficiency, ranked #282 of 342 in WI (top 82%) — low school quality limits family demand, transient renter base, plan for 1-2y turnover.
- Watch-outs: built in 1890 — expect roof / HVAC / electrical / plumbing capex.
- Market conditions: Rents rising fast (+11.1%/yr); 97 active listings in the ZIP; 3 comparable units currently listed for rent nearby; rentals lingering (median 44d on market — plan ~5-8 weeks vacancy on turnover, expect pricing pressure); 100% of comp listings sitting > 30 days — soft ceiling on asking rent; 383 units permitted in Sheboygan County in 2024 (105 in 5+ unit buildings).
- Sheboygan County population projected to shrink 8% by 2050 — rents likely to lag national; underwrite the cash flow, not the appreciation.
- Cap rate 6.3% vs local median 3.1% in Sheboygan — top-decile yield for the area; either an underpriced asset or a hidden risk that comps aren't pricing in. Stress-test before assuming the spread holds.
- This rent runs 38% of the median local income ($64k/yr) — at the standard rent-burdened threshold; future hikes will face affordability resistance.
Questions for listing agent
- What do current leases actually rent for vs. the listed asking? Can we see a recent rent roll and the last 12 months of T-12 income?
- Can we see the unit-by-unit rent roll, current vacancy, and any below-market leases? What's the average tenancy length?
- What capital expenditures (roof, boiler, parking lot, exteriors) have been made in the last 5 years, and what's planned in the next 2?
- Built in 1890 — when were the roof, HVAC, electrical panel, plumbing, and water heater last replaced?
- Is there a deadline driving the sale (1031 exchange, divorce, estate, relocation)? That informs how much negotiation room exists.
- Schools are D-rated, which usually means shorter tenancies and higher turnover. Who's the typical renter profile here, and what's been the actual vacancy rate?
- The area grade is low — what's the realistic commute time and amenity access for the typical tenant pool here? Any planned neighborhood developments (good or bad) we should know about?
- What's the average days-on-market for RENTAL listings here right now (not sales)? A rising rental-DOM trend means longer vacancies and softer asking-rent achievability than the comps imply.
CashFlowRE · CFR-2YT1MR23H2CVF3
· Data 1 day ago
cashflowre.app · 2026-05-29