 Duplex
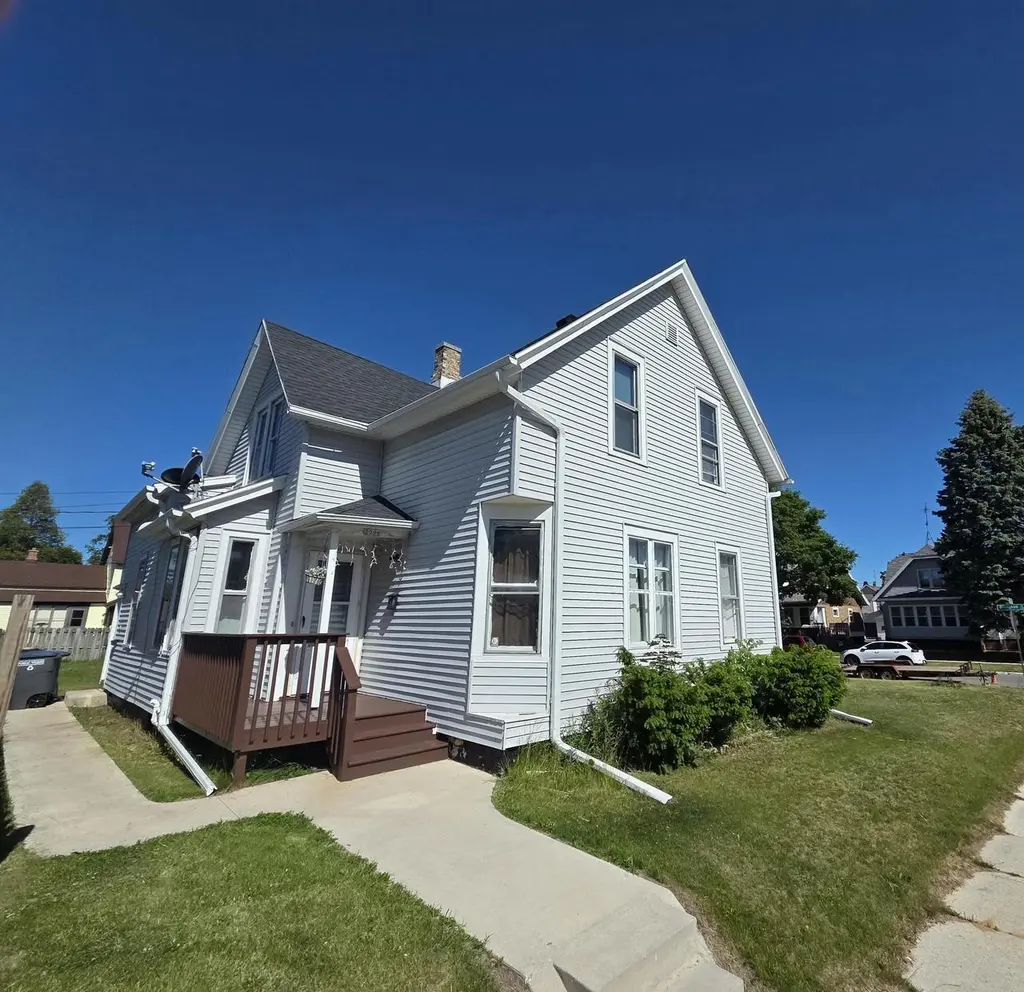
2006 S 11th St #2008 · Sheboygan, WI
Flood risk 1/10 · Minimal
- FEMA flood zone
- X (unshaded)
- Chance of flooding over 30 yrs
- 0.0%
- Est. flood insurance / yr
- $473 – $860
Fire risk 1/10 · Minimal
- Est. fire insurance / yr
- $636 – $1,182
Heat risk 1/10 · Minimal
- Hot days now (above 94°F)
- 7 days/yr
- Hot days in 30 yrs
- 13 days/yr
Wind risk 2/10 · Minimal
- Chance of severe wind over 30 yrs
- —
Air-quality risk 3/10 · Minor
- Unhealthy air days now
- 3 days/yr
- Unhealthy air days in 30 yrs
- 4 days/yr
Risk factors via First Street. Map © Google.
Why this score? — see what drove the D- grade
The composite is a weighted blend of 9 inputs, each scored 0–100. Each bar is that input's sub-score; the figure is the points it added to the 100-point composite (weight × sub-score).
- Cash flow +13.1/30.0
- Rent growth +5.0/5.0
- DSCR +3.9/10.0
- Livability +3.9/5.0
- Condition / age +3.8/5.0
- 1% rule +3.7/10.0
- Schools +2.6/10.0
- ARV discount +0.0/15.0
- Appreciation +0.0/10.0
$229,999
🖨 Deal sheet 📄 Offer letter ✓ Due diligence
Multi-family units
County records classify this as Multi-Family (2-4 Unit). Listing-text estimate: 2 units. confirmed
Listing remarks
Sheboygan South Side Duplex - Investment Opportunity!Conveniently located near schools and parks, this 2-unit property features:Lower Unit: 2 bedrooms, attached garage, long-term tenant paying $850/month. Lease expires November 2026.Upper Unit: 2 bedrooms, fully remodeled and move-in ready. Perfect for investors or owner-occupants looking for rental income and a great location.
Key facts
- Near schools
- Move-in ready
- Fully remodeled
Tags
Property features AI
Finance
- Other: Inclusions: 2 refrigerators and 2 stoves; Exclusions: seller/tenant personal property
- Financial info: Not specified
- HOA & community: Not specified
Exterior
- Parking: Attached garage with opener for 1 car; Total garage parking listed as 1.5 spaces; Additional parking: 1 space
- Security: Not specified
- Utilities: Municipal water; Municipal sewer; 2 electric meters; 2 gas meters
- Home design: 2-story duplex; Multi-family property
- Construction: Construction year from assessor/public records (year built not specified)
- Exterior features: Vinyl exterior with aluminum trim; Lot is less than 1/2 acre (approx. 0.1 acre); Zoned residential
Interior
- Kitchen: Unit 2 kitchen on upper level (approx. 14 x 12); Two refrigerators and two stoves included
- Bedrooms: Unit 1: 2 bedrooms; Unit 2: 2 bedrooms (master and second bedroom on upper level; master approx. 14 x 12, second approx. 12 x 10)
- Flooring: Not specified
- Bathrooms: Unit 1: 1 full bathroom; Unit 2: 1 full bathroom
- Heating & cooling: Not specified
- Interior features: Full basement
- Laundry & utility: Not specified
Neighborhood map
What this means for you Summary
Snapshot
- This is a 2 × 2-bed/1.0-bath units multifamily listed at $230k. Condition is rated good.
Deal economics
- At list price, monthly cash flow is $-8 ($-95/yr) — negative. Per door: $-4/mo.
- To cash-flow at today's rent, offer at most $229k (0.5% below list).
- To meet the 1% rule (rent ≥ 1% of price), the offer needs to be $200k (13.0% below list).
- Recommended offer: $200k (13.0% below list) — sets the bar for 1% rule.
- Cap rate 6.3% vs local median 3.1% in Sheboygan — top-decile yield for the area; either an underpriced asset or a hidden risk that comps aren't pricing in. Stress-test before assuming the spread holds.
Location & tenants
- Location reads 77/100 on livability (#117 in WI, #3,019 nationally) — a middle-class / working-renter tenant base. Strengths: cost of living A+, housing A+, health & safety A+; Watch: crime C-, employment C-, schools D+.
- Sheboygan Area School District (urban): math 28% / reading 31% proficiency, ranked #282 of 342 in WI (top 82%) — low school quality limits family demand, transient renter base, plan for 1-2y turnover.
- Market conditions: Rents rising fast (+11.1%/yr); 97 active listings in the ZIP; 3 comparable units currently listed for rent nearby; rentals lingering (median 44d on market — plan ~5-8 weeks vacancy on turnover, expect pricing pressure); 100% of comp listings sitting > 30 days — soft ceiling on asking rent; 383 units permitted in Sheboygan County in 2024 (105 in 5+ unit buildings).
- This rent runs 38% of the median local income ($64k/yr) — at the standard rent-burdened threshold; future hikes will face affordability resistance.
Forward outlook
- Local home prices are declining (-3.0%/yr); year-one equity from $2k of loan paydown is wiped out by about $7k of value loss. Plan a longer hold.
- Sheboygan County population projected to shrink 8% by 2050 — rents likely to lag national; underwrite the cash flow, not the appreciation.
Negotiation context
- Only 3 days on market — expect competitive offers; lowballing is unlikely to land.
Risks & watch-outs
- Watch-outs: built in 1890 — expect roof / HVAC / electrical / plumbing capex.
Questions for the listing agent
- What do current leases actually rent for vs. the listed asking? Can we see a recent rent roll and the last 12 months of T-12 income?
- Can we see the unit-by-unit rent roll, current vacancy, and any below-market leases? What's the average tenancy length?
- What capital expenditures (roof, boiler, parking lot, exteriors) have been made in the last 5 years, and what's planned in the next 2?
- Built in 1890 — when were the roof, HVAC, electrical panel, plumbing, and water heater last replaced?
- Is there a deadline driving the sale (1031 exchange, divorce, estate, relocation)? That informs how much negotiation room exists.
- Schools are D-rated, which usually means shorter tenancies and higher turnover. Who's the typical renter profile here, and what's been the actual vacancy rate?
- The area grade is low — what's the realistic commute time and amenity access for the typical tenant pool here? Any planned neighborhood developments (good or bad) we should know about?
- What's the average days-on-market for RENTAL listings here right now (not sales)? A rising rental-DOM trend means longer vacancies and softer asking-rent achievability than the comps imply.
- What's the recent tenant-quality profile in this submarket — average credit score on applications, eviction rate, late-payment / NSF rate, and stable-employment percentage? A property-management company in the area should have these aggregated.
- How much new apartment / multifamily construction is in the pipeline within 1–3 miles? Heavy new supply (>2% of stock underway) typically softens rents 12–24 months out; light construction supports rent growth.
Investment metrics
- 1% rule
- 0.87% ✗
- Cap rate
- 6.25%
- Cash-on-cash
- -0.15%
- DSCR
- 0.99
- GRM
- 9.6
CMA / ARV
- ARV (on-the-fly)
- $189,114
- Comps found
- 10
Show comp detail 10 sales within ~0.75 mi
| Address | Dist | Beds/Ba | Sqft | Sold | Price | $/sf | Match |
|---|---|---|---|---|---|---|---|
| 2006 S 11th St Unit 2006A | 0.00mi | 4/2.0 | 1,466 (0%) | 7mo | $180,000 | $123 | 94 |
| 1912 S 12th St Unit 1912A | 0.13mi | 4/2.0 | 1,560 (+6%) | 4mo | $224,900 | $144 | 80 |
| 1808 S 13th St #1806 | 0.21mi | 5/2.0 (+1) | 1,556 (+6%) | 3mo | $253,250 | $163 | 73 |
| 1720 S 11th St Unit 1720A | 0.18mi | 4/2.0 | 1,372 (-6%) | 11mo | $218,500 | $159 | 71 |
| 2308 S 8th St #2306 | 0.32mi | 3/2.0 (-1) | 1,418 (-3%) | 4mo | $185,000 | $130 | 71 |
| 1009 Clara Ave #1007 | 0.39mi | 4/2.0 | 1,440 (-2%) | 21mo | $180,000 | $125 | 61 |
| 1443 S 9th St #1445 | 0.46mi | 4/2.0 | 1,373 (-6%) | 12mo | $175,000 | $127 | 58 |
| 831 Oakland Ave | 0.24mi | 3/2.0 (-1) | 1,256 (-14%) | 11mo | $140,000 | $111 | 51 |
| 1025 Indiana Ave #1027 | 0.72mi | 4/2.0 | 1,564 (+7%) | 8mo | $150,000 | $96 | 48 |
| 1512 Georgia Ave | 0.63mi | 3/2.5 (-1) | 1,470 (+0%) | 23mo | $190,000 | $129 | 44 |
Match score weights: distance 35% · size 25% · config 20% · recency 20%. Top-matched comps best support the ARV.
Projected returns pro-forma
-3.0% appreciation · 8.0% rent growth · sell at horizon
- IRR
- -11.1%
- Equity multiple
- 0.58×
- Total profit
- $-27,162
- Equity at exit
- $34,294
- IRR
- 4.2%
- Equity multiple
- 1.37×
- Total profit
- $23,978
- Equity at exit
- $19,886
Cash invested: $64,400 (down + closing). Projections, not guarantees.
Landlord ↔ Tenant lean methodology
- Overall (STATE)
- 73 Landlord-Friendly
- State Wisconsin
- 73 Landlord-Friendly · R+2
- County
- — inherits STATE
- City
- — inherits STATE
ZIP-level market 53081
- Home prices YoY
- -34.0%
- Rents YoY
- 11.1%
- Active inventory
- 97
- Price-to-rent
- 19.2×
Monthly cashflow live
- Estimated rent
- $2,002 medium interval (Pro) →
- Mortgage (P&I)
- −$1,206
- Tax est. 1.5%
- −$287 /mo · $3,450/yr
- Insurance
- −$96
- HOA
- −$0
- Vacancy / Maint / Mgmt
- −$420
- Net cashflow
- $-8
Break-even live
2-unit breakdown (identical units grouped — click to expand)
| Units | Beds | Baths | Est. rent |
|---|---|---|---|
| 2× units | 2 | 1 | $2,002 |
| #1 | 2 | 1 | $1,001 |
| #2 | 2 | 1 | $1,001 |
| Total (2 units) | $2,002 | ||
UW: 25.0% down · 7.5% · 30yr · 1.5% tax · 5.0% vac · 8.0% maint · 8.0% mgmt
Financing live
Cash to close
- Down payment
- $57,500
- Closing costs
- $6,900
- Reserves months
- —
- Total cash needed
- —
Loan-product check · same deal, 3 products live
Conventional
25% down · 7.5% · 30yr
- Down + closing
- —
- Monthly P&I
- —
- Monthly cashflow
- —
- DSCR
- —
- Eligible?
- —
Personal DTI + credit; lowest rate.
DSCR
20% down · 8.5% · 30yr
- Down + closing
- —
- Monthly P&I
- —
- Monthly cashflow
- —
- DSCR
- —
- Eligible?
- —
No personal income docs; deal must DSCR.
Hard money
10% down · 12.0% · 12mo
- Down + closing
- —
- Monthly P&I
- —
- Monthly cashflow
- —
- DSCR
- —
- Eligible?
- —
Short-term bridge; refi at stabilization.
Rent comps 3 comps
| Address | Beds | Baths | Sqft | Rent | $/sqft | DOM | Units | Dist |
|---|---|---|---|---|---|---|---|---|
| 2002 S 14th St Sheboygan, WI | 3.0 | 2.0 | 1036 | $995 | $0.96 | 43d | 1 | 0.27mi |
| 520 S Water St Sheboygan, WI | 4.0 | 1.0 | 1616 | $1,500 | $0.93 | 43d | 1 | 1.13mi |
| 1324 New York Ave Sheboygan, WI | 3.0 | 1.0 | 900 | $1,000 | $1.11 | 43d | 1 | 1.34mi |
Listing history 4 events
-
2026-06-19days on market $229,999 Active 3 DOM
-
2026-06-18days on market $229,999 Active 2 DOM
-
2026-06-17remarks 380-char remark
-
2026-06-17$229,999 Active 1 DOM
ⓘ Source: listings_history table (triggers on properties + properties_extension) + one-shot
backfill from property_details.listing_events for pre-trigger history.
Climate risk First Street
- Flood 1/10 Low FEMA zone X (unshaded) · 0% chance over 30 yrs
- Wildfire 1/10 Low
- Heat 1/10 Low 7 d/yr ≥94°F today · 13 d/yr by 30 yrs out
- Wind 2/10 Low
- Air quality 3/10 Moderate 3 unhealthy d/yr today · 4 by 30 yrs out
Nearby sold comps map
Loading sold comps map…
Walkable amenities ~0.75 mi
Loading nearby amenities…
Taxation est. · year 1
- Rental income
- $24,024
- − Mortgage interest
- −$12,884
- − Property taxes
- −$3,450
- − Insurance
- −$1,150
- − Repairs & maintenance
- −$1,922
- − Management
- −$1,922
- − Depreciation
- −$6,691
- Taxable loss
- −$3,994
- Est. tax savings @ 24.0%
- +$959
- After-tax cash flow
- $864/yr
For passive investors: Depreciation is non-cash, so a rental often shows a tax loss while cash-flowing — sheltering income. Rental losses are passive: they offset passive income freely, and up to $25,000/yr can offset ordinary (W-2) income if you actively participate and your MAGI is under $100k (phasing out to $0 by $150k); unused losses carry forward. On sale, claimed depreciation is recaptured at up to 25%, and gains may owe capital-gains tax (a 1031 exchange can defer both). Figures are a year-1 estimate at your 24.0% rate — not tax advice; consult a CPA.
Condition & rehab AI · 12 photos
This 2-unit property is in good condition with cosmetic updates needed. The upper unit is fully remodeled and move-in ready, making it a great investment opportunity.
Value-add opportunities
- Both Paint exterior — Enhances curb appeal and resale value
- Both Replace carpet in bedrooms — Improves rental appeal and resale value
- Both Update kitchen appliances — Modernizes kitchen and improves rental appeal
Renovation cost estimate screening
Value-add ROI direction
- Both Paint exterior — Enhances curb appeal and resale value ↑
- Both Replace carpet in bedrooms — Improves rental appeal and resale value ↑
- Both Update kitchen appliances — Modernizes kitchen and improves rental appeal ↑
ⓘ Cost ranges are severity-bucket heuristics (US national rule-of-thumb). Get contractor quotes + a written scope before underwriting a rehab budget.
Schools (NCES district)
- District
- Sheboygan Area School District
- NCES district ID
- 5513650
- Math proficiency
- 28% ▼ -8.00%
- Reading proficiency
- 31% ▼ -5.00%
- Median HH income
- $47,301
- Composite
- 25.53/100
- National rank
- #7435
- State rank
- #282 of 342 in WI
Livability — Sheboygan
- Score
- 77/100
- State rank
- #117
- US rank
- #3019
Category grades
Schools grade is shown separately in the Schools card above.
Census & demographics
- Census place
- Sheboygan, WI
- County
- Sheboygan County · 59,517 people
- City population
- 43,381
- Metro
- Sheboygan, WI
- Population (ZIP)
- 43,381
- Household income
- $64,042
- Rent vs Own
- Severe rent burden
- 1312.0
Population outlook (Sheboygan County) Hauer SSP2
- Today (2025)
- 115,612 people
- By 2030
- 114,575 · -0.9%
- By 2040
- 110,767 · -4.2%
- By 2050
- 106,170 · -8.2%
- By 2075
- 100,361 · -13.2%
- By 2100
- 92,749 · -19.8%
Race, ethnicity, and origin ACS 2023
- Neighborhood character
- Predominantly White (71%)
- Race & ethnicity
- White 71% Asian 11% Hispanic / Latino 11% Two or more races 8% Black 4%
- Hispanic origin (detail)
- Mexican 8% Puerto Rican 2%
- Common ancestry
- Portuguese 4% Iranian 4% Romanian 3%
- Foreign-born
- 9% · Canada, China
- Languages at home
- 83% English-only · Other Asian/Pacific 8% Spanish 7% Other Indo-European 1%
Political lean MEDSL · Sheboygan
- 2024 margin
- R (+16.4) · D 41.1% · R 57.5% · Other 1.4%
- 2008→2024 swing
- -15.7pp toward R · 2008: -0.7pp · 2024: -16.4pp
- All cycles
- 2024: R+16.4 2020: R+15.9 2016: R+16.7 2012: R+9.4 2008: R+0.7
Not yet ingested
- Civics
- —
Market trends
- HPI YoY
- ▼ -116.80%
- Current HPI
- 226.7468
- Rent YoY
- ▲ 11.07%
- Metro
- Sheboygan, WI
- State GDP YoY
- ▲ 2.10%
- F500 in state
- 20
Industry mix (Fortune 500 HQ in WI)
| Industry | F500 HQs | Revenue |
|---|---|---|
| Industrial Machinery | 4 | $23B |
|
||
| Industrial Technology | 2 | $36B |
|
||
| Insurance | 1 | $36B |
|
||
| Professional Services | 1 | $19B |
|
||
| Utilities | 1 | $9B |
|
||
| Consumer Goods | 1 | $3B |
|
||
Price history
1 event — show timeline
- 2026-06-16 Listed $229,999 METROMLS
Cash-flow waterfall
monthlySold comps — $/sqft
last 12 mo · ≤1 miLoading sold comps…