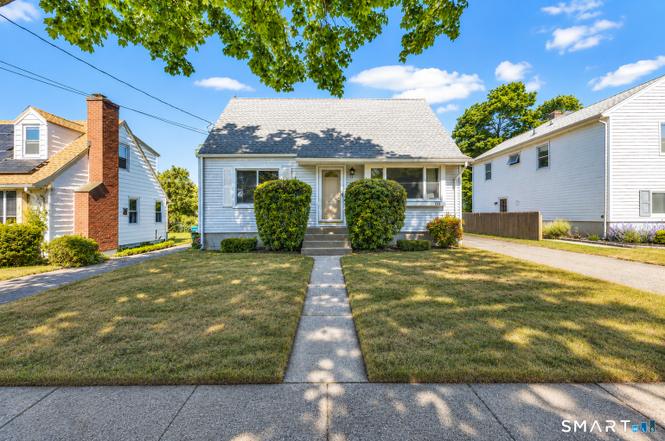
135 Sixth Ave
Stratford, CT 06615
$505,000D+
3 bd · 1.0 ba ·
1,373 sqft ·
Built 1953
· SingleFamily
· Active
· 10 DOM
Cashflow @ list (25.0% down · 7.5%)
Estimated rent
$4,737/mo
Mortgage (P&I)
−$2,648
Tax + insurance
−$828
HOA
−$0
Vac / Maint / Mgmt
−$995
Net cashflow
$266/mo
Annual
$3,194/yr
Cap rate
6.93%
Cash-on-cash
2.26%
DSCR
1.10
1% rule
0.94%
Cash to close
$141,400
Investor read
- This is a 3-bed/1.0-bath single-family listed at $505k.
- At list price, monthly cash flow is $266 ($3k/yr) — positive.
- The deal already cash-flows at list — no discount required.
- To meet the 1% rule (rent ≥ 1% of price), the offer needs to be $474k (6.2% below list).
- Only 10 days on market — expect competitive offers; lowballing is unlikely to land.
- Recommended offer: $474k (6.2% below list) — sets the bar for 1% rule.
- Local home prices are declining (-3.0%/yr); year-one equity from $3k of loan paydown is wiped out by about $15k of value loss. Plan a longer hold.
- Location reads 76/100 on livability (#56 in CT, #3,523 nationally) — a middle-class / working-renter tenant base. Strengths: housing A+, health & safety A+, crime A-; Watch: commute F.
- Stratford School District (urban): math 22% / reading 38% proficiency, ranked #122 of 153 in CT (top 80%) — families likely to look elsewhere, expect single-tenant / working-renter base with shorter leases.
- Zoned schools: Lordship School (math 22% / reading 32%, grade F, #401 of 553 statewide, top 74%, 177 students, 48% FRL); David Wooster Middle School (math 18% / reading 40%, grade F, #143 of 175 statewide, top 83%, 539 students, 51% FRL); Stratford High School (math 19% / reading 46%, grade F, #125 of 194 statewide, top 66%, 1,127 students, 45% FRL) — zoned schools average 48% FRL vs 31% district-wide (17 pts higher); higher-poverty schools than district average — tighter screening recommended.
- Watch-outs: built in 1953 — expect roof / HVAC / electrical / plumbing capex.
- Market conditions: 76 active listings in the ZIP; 2 comparable units currently listed for rent nearby; solid renter incomes; 852 units permitted in Greater Bridgeport Planning Region in 2024 (698 in 5+ unit buildings).
- Climate carrying-cost: major flood risk; major wind risk, 68% chance of damaging wind over 30y; extreme-heat days projected 7→15/yr by 2055 (HVAC capex compounding) — expect insurance premiums to compound above CPI over the hold.
- At $4,737/mo this rent would consume 70% of the median local household income ($82k/yr) (locally 507% of renters already pay >50% of income on rent) — very limited rent-growth headroom before tenants either downsize or default.
Questions for listing agent
- Built in 1953 — when were the roof, HVAC, electrical panel, plumbing, and water heater last replaced?
- Is there a deadline driving the sale (1031 exchange, divorce, estate, relocation)? That informs how much negotiation room exists.
- The area grade is low — what's the realistic commute time and amenity access for the typical tenant pool here? Any planned neighborhood developments (good or bad) we should know about?
- What's the average days-on-market for RENTAL listings here right now (not sales)? A rising rental-DOM trend means longer vacancies and softer asking-rent achievability than the comps imply.
- What's the recent tenant-quality profile in this submarket — average credit score on applications, eviction rate, late-payment / NSF rate, and stable-employment percentage? A property-management company in the area should have these aggregated.
- How much new for-sale + rental construction is in the pipeline within 1–3 miles? Heavy new supply typically softens prices + rents 12–24 months out; constrained supply supports both.
CashFlowRE · CFR-2YVSCAA73FWXEG
· Data 9 h ago
cashflowre.app · 2026-05-29