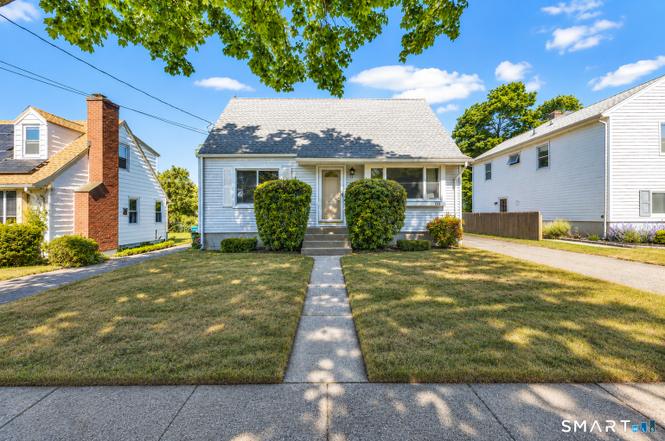
135 Sixth Ave · Stratford, CT
Flood risk 6/10 · Moderate
- FEMA flood zone
- X (unshaded)
- Chance of flooding over 30 yrs
- 0.59%
- Est. flood insurance / yr
- $473 – $860
Fire risk 1/10 · Minimal
- Est. fire insurance / yr
- $829 – $1,539
Heat risk 6/10 · Moderate
- Hot days now (above 96°F)
- 7 days/yr
- Hot days in 30 yrs
- 15 days/yr
Wind risk 6/10 · Moderate
- Chance of severe wind over 30 yrs
- 68.0%
Air-quality risk 4/10 · Minor
- Unhealthy air days now
- 5 days/yr
- Unhealthy air days in 30 yrs
- 7 days/yr
Risk factors via First Street. Map © Google.
Why this score? — see what drove the D+ grade
The composite is a weighted blend of 9 inputs, each scored 0–100. Each bar is that input's sub-score; the figure is the points it added to the 100-point composite (weight × sub-score).
- Cash flow +16.2/30.0
- ARV discount +10.3/15.0
- DSCR +5.0/10.0
- 1% rule +4.4/10.0
- Livability +3.8/5.0
- Schools +2.8/10.0
- Rent growth +2.5/5.0
- Condition / age +2.5/5.0
- Appreciation +0.0/10.0
$505,000
🖨 Deal sheet (PDF) 📄 Offer letter ✓ Due diligence
Listing remarks
Welcome to Lordship! Lovingly maintained by the same family since 1965, this charming Cape Cod-style home is ready for its next chapter. Tucked away on a quiet dead-end street, the property enjoys a peaceful setting w/ LI Sound & marsh views from 1st flr BR, Kitchen & the backyard & is just steps from Long Beach & the shoreline. Inside, hardwood flooring runs throughout most of the home. The main level features a spacious living room & dining area, an eat-in kitchen with direct access to the backyard, a primary bedroom, & a full bath. Upstairs offers two additional bedrooms, providing flexibility for family, guests, or a home office. Beyond the home itself
Key facts
- Marsh views
- Waterfront community
- Lordship seawall
Tags
Property features AI
Exterior
- Parking: Detached garage (1); Paved private driveway; Total of 3 parking spaces
- Utilities: Public water connected; Public sewer connected; Oil fuel (tank in basement)
- Home design: Single-family home
- Construction: Frame construction with vinyl siding; Asphalt shingle roof; Concrete foundation; Gray exterior color
- Exterior features: Gutters; Level lot with water view; within a water community and walking distance to water; Nearby amenities: basketball court, golf course, health club, library, medical facilities, park, playground/tot lot, shopping/mall
Interior
- Kitchen: Electric range; Refrigerator; Dishwasher
- Bedrooms: 3 bedrooms
- Bathrooms: 1 full bathroom
- Heating & cooling: Central air; Hot air heating (oil-fired) with oil hot water
- Interior features: Cable available; Full unfinished basement with concrete floor and storage; Attic with crawl space and storage
- Laundry & utility: Washer and dryer included; Laundry located on lower level
Neighborhood map
What this means for you Summary
Snapshot
- This is a 3-bed/1.0-bath single-family listed at $505k.
Deal economics
- At list price, monthly cash flow is $266 ($3k/yr) — positive.
- The deal already cash-flows at list — no discount required.
- To meet the 1% rule (rent ≥ 1% of price), the offer needs to be $474k (6.2% below list).
- Recommended offer: $474k (6.2% below list) — sets the bar for 1% rule.
Location & tenants
- Location reads 76/100 on livability (#56 in CT, #3,523 nationally) — a middle-class / working-renter tenant base. Strengths: housing A+, health & safety A+, crime A-; Watch: commute F.
- Stratford School District (urban): math 22% / reading 38% proficiency, ranked #122 of 153 in CT (top 80%) — families likely to look elsewhere, expect single-tenant / working-renter base with shorter leases.
- Zoned schools: Lordship School (math 22% / reading 32%, grade F, #401 of 553 statewide, top 74%, 177 students, 48% FRL); David Wooster Middle School (math 18% / reading 40%, grade F, #143 of 175 statewide, top 83%, 539 students, 51% FRL); Stratford High School (math 19% / reading 46%, grade F, #125 of 194 statewide, top 66%, 1,127 students, 45% FRL) — zoned schools average 48% FRL vs 31% district-wide (17 pts higher); higher-poverty schools than district average — tighter screening recommended.
- Market conditions: 76 active listings in the ZIP; 2 comparable units currently listed for rent nearby; solid renter incomes; 852 units permitted in Greater Bridgeport Planning Region in 2024 (698 in 5+ unit buildings).
- At $4,737/mo this rent would consume 70% of the median local household income ($82k/yr) (locally 507% of renters already pay >50% of income on rent) — very limited rent-growth headroom before tenants either downsize or default.
Forward outlook
- Local home prices are declining (-3.0%/yr); year-one equity from $3k of loan paydown is wiped out by about $15k of value loss. Plan a longer hold.
Negotiation context
- Only 10 days on market — expect competitive offers; lowballing is unlikely to land.
Risks & watch-outs
- Watch-outs: built in 1953 — expect roof / HVAC / electrical / plumbing capex.
- Climate carrying-cost: major flood risk; major wind risk, 68% chance of damaging wind over 30y; extreme-heat days projected 7→15/yr by 2055 (HVAC capex compounding) — expect insurance premiums to compound above CPI over the hold.
Questions for the listing agent
- Built in 1953 — when were the roof, HVAC, electrical panel, plumbing, and water heater last replaced?
- Is there a deadline driving the sale (1031 exchange, divorce, estate, relocation)? That informs how much negotiation room exists.
- The area grade is low — what's the realistic commute time and amenity access for the typical tenant pool here? Any planned neighborhood developments (good or bad) we should know about?
- What's the average days-on-market for RENTAL listings here right now (not sales)? A rising rental-DOM trend means longer vacancies and softer asking-rent achievability than the comps imply.
- What's the recent tenant-quality profile in this submarket — average credit score on applications, eviction rate, late-payment / NSF rate, and stable-employment percentage? A property-management company in the area should have these aggregated.
- How much new for-sale + rental construction is in the pipeline within 1–3 miles? Heavy new supply typically softens prices + rents 12–24 months out; constrained supply supports both.
Investment metrics
- 1% rule
- 0.94% ✗
- Cap rate
- 6.93%
- Cash-on-cash
- 2.26%
- DSCR
- 1.10
- GRM
- 8.9
CMA / ARV
- ARV (on-the-fly)
- $538,216
- Comps found
- 9
Show comp detail 9 sales within ~0.75 mi
| Address | Dist | Beds/Ba | Sqft | Sold | Price | $/sf | Match |
|---|---|---|---|---|---|---|---|
| 159 Jefferson St | 0.45mi | 3/2.0 | 1,342 (-2%) | 10mo | $560,000 | $417 | 63 |
| 184 Pauline St | 0.51mi | 3/1.5 | 1,466 (+7%) | 0mo | $582,000 | $397 | 62 |
| 131 5th Ave | 0.06mi | 3/2.0 | 1,483 (+8%) | 22mo | $550,000 | $371 | 61 |
| 251 2nd Ave | 0.27mi | 4/1.0 (+1) | 1,451 (+6%) | 22mo | $411,156 | $283 | 54 |
| 275 Washington Pkwy | 0.35mi | 3/1.5 | 1,532 (+12%) | 11mo | $600,000 | $392 | 53 |
| 545 Washington Pkwy | 0.50mi | 2/1.5 (-1) | 1,288 (-6%) | 17mo | $442,000 | $343 | 45 |
| 305 1st Ave | 0.43mi | 3/2.0 | 1,221 (-11%) | 20mo | $560,000 | $459 | 41 |
| 186 Jefferson St | 0.49mi | 2/1.5 (-1) | 1,205 (-12%) | 13mo | $655,000 | $544 | 39 |
| 130 Grove St | 0.68mi | 4/2.0 (+1) | 1,520 (+11%) | 13mo | $524,000 | $345 | 31 |
Match score weights: distance 35% · size 25% · config 20% · recency 20%. Top-matched comps best support the ARV.
Projected returns pro-forma
-3.0% appreciation · 3.0% rent growth · sell at horizon
- IRR
- -12.7%
- Equity multiple
- 0.54×
- Total profit
- $-64,815
- Equity at exit
- $75,297
- IRR
- -3.6%
- Equity multiple
- 0.76×
- Total profit
- $-34,354
- Equity at exit
- $43,663
Cash invested: $141,400 (down + closing). Projections, not guarantees.
Landlord ↔ Tenant lean methodology
- Overall (STATE)
- 27 Tenant-Leaning
- State Connecticut
- 27 Tenant-Leaning · D+7
- County
- — inherits STATE
- City
- — inherits STATE
ZIP-level market 06615
- Active inventory
- 76
- Price-to-rent
- 8.9×
Monthly cashflow live
- Estimated rent
- $4,737 medium interval (Pro) →
- Mortgage (P&I)
- −$2,648
- Tax from tax record
- −$617 /mo · $7,409/yr
- Insurance
- −$210
- HOA
- −$0
- Vacancy / Maint / Mgmt
- −$995
- Net cashflow
- $266
Break-even live
Sensitivity live
| Price | -10% $552 | -5% $409 | +0% $266 | +5% $123 | +10% $-20 |
|---|---|---|---|---|---|
| Rent | -10% $-108 | -5% $79 | +0% $266 | +5% $453 | +10% $640 |
| Rate | -1.0pp $521 | -0.5pp $395 | base $266 | +0.5pp $135 | +1.0pp $2 |
UW: 25.0% down · 7.5% · 30yr · 1.5% tax · 5.0% vac · 8.0% maint · 8.0% mgmt
Financing live
Cash to close
- Down payment
- $126,250
- Closing costs
- $15,150
- Reserves months
- —
- Total cash needed
- —
Loan-product check · same deal, 3 products live
Conventional
25% down · 7.5% · 30yr
- Down + closing
- —
- Monthly P&I
- —
- Monthly cashflow
- —
- DSCR
- —
- Eligible?
- —
Personal DTI + credit; lowest rate.
DSCR
20% down · 8.5% · 30yr
- Down + closing
- —
- Monthly P&I
- —
- Monthly cashflow
- —
- DSCR
- —
- Eligible?
- —
No personal income docs; deal must DSCR.
Hard money
10% down · 12.0% · 12mo
- Down + closing
- —
- Monthly P&I
- —
- Monthly cashflow
- —
- DSCR
- —
- Eligible?
- —
Short-term bridge; refi at stabilization.
Rent comps 2 comps
| Address | Beds | Baths | Sqft | Rent | $/sqft | DOM | Units | Dist |
|---|---|---|---|---|---|---|---|---|
| 15 Shoreline Dr #15 Stratford, CT | 2.0 | 1.0 | 1344 | $8,000 | $5.95 | 25d | 1 | 0.43mi |
| 164 Meadowview Ave Stratford, CT | 3.0 | 1.5 | 1188 | $2,800 | $2.36 | 45d | 1 | 1.38mi |
Listing history 8 events
-
2026-06-21days on market $505,000 Active 10 DOM
-
2026-06-18days on market $505,000 Active 7 DOM
-
2026-06-17days on market $505,000 Active 6 DOM
-
2026-06-16days on market $505,000 Active 5 DOM
-
2026-06-15days on market $505,000 Active 4 DOM
-
2026-06-13days on market $505,000 Active 2 DOM
-
2026-06-13remarks 675-char remark
-
2026-06-13$505,000 Active 1 DOM
ⓘ Source: listings_history table (triggers on properties + properties_extension) + one-shot
backfill from property_details.listing_events for pre-trigger history.
Tax reassessment forecast CT · Partial reset (capped growth)
- Current annual tax
- $7,409 · $617/mo
- Projected year-2 tax
- $9,108 · $759/mo
- Expected delta
- +$1,699/yr (+$142/mo · 22.9%)
ⓘ Screening estimate from a state-policy table — verify with the county assessor before closing.
Climate risk First Street
- Flood 6/10 Major FEMA zone X (unshaded) · 59% chance over 30 yrs
- Wildfire 1/10 Low
- Heat 6/10 Major 7 d/yr ≥96°F today · 15 d/yr by 30 yrs out
- Wind 6/10 Major 68% chance of damaging wind over 30 yrs
- Air quality 4/10 Moderate 5 unhealthy d/yr today · 7 by 30 yrs out
Nearby sold comps map
Loading sold comps map…
Walkable amenities ~0.75 mi
Loading nearby amenities…
Taxation est. · year 1
- Rental income
- $56,845
- − Mortgage interest
- −$28,288
- − Property taxes
- −$7,409
- − Insurance
- −$2,525
- − Repairs & maintenance
- −$4,548
- − Management
- −$4,548
- − Depreciation
- −$14,691
- Taxable loss
- −$5,163
- Est. tax savings @ 24.0%
- +$1,239
- After-tax cash flow
- $4,433/yr
For passive investors: Depreciation is non-cash, so a rental often shows a tax loss while cash-flowing — sheltering income. Rental losses are passive: they offset passive income freely, and up to $25,000/yr can offset ordinary (W-2) income if you actively participate and your MAGI is under $100k (phasing out to $0 by $150k); unused losses carry forward. On sale, claimed depreciation is recaptured at up to 25%, and gains may owe capital-gains tax (a 1031 exchange can defer both). Figures are a year-1 estimate at your 24.0% rate — not tax advice; consult a CPA.
Schools (NCES district)
- District
- Stratford School District
- NCES district ID
- 0904440
- Math proficiency
- 22% ▼ -12.00%
- Reading proficiency
- 38% ▼ -10.00%
- Median HH income
- $67,912
- Composite
- 27.85/100
- National rank
- #6877
- State rank
- #122 of 153 in CT
Livability — Stratford
- Score
- 76/100
- State rank
- #56
- US rank
- #3523
Category grades
Schools grade is shown separately in the Schools card above.
Census & demographics
- Census place
- Lordship, CT
- County
- Fairfield County · 765,532 people
- City population
- 17,136
- Metro
- Bridgeport-Stamford-Norwalk, CT
- Population (ZIP)
- 17,136
- Household income
- $81,534
- Rent vs Own
- Severe rent burden
- 507.0
Population outlook (Greater Bridgeport County) Hauer SSP2
- By 2040
- 365,581
Race, ethnicity, and origin ACS 2023
- Neighborhood character
- Diverse neighborhood (Simpson 0.63)
- Race & ethnicity
- White 53% Hispanic / Latino 24% Black 18% Two or more races 6% Asian 3%
- Hispanic origin (detail)
- Mexican 2% Puerto Rican 13%
- Common ancestry
- Romanian 5% Hispanic 3% Lithuanian 2%
- Foreign-born
- 18% · Canada, South Korea, Jamaica
- Languages at home
- 74% English-only · Spanish 17% French/Haitian/Cajun 2% Other Indo-European 2%
Political lean MEDSL · Greater Bridgeport
- 2024 margin
- Strong D (+23.3) · D 60.9% · R 37.6% · Other 1.5%
- All cycles
- 2024: D+23.3
Not yet ingested
- Civics
- —
Market trends
- HPI YoY
- ▼ -359.68%
- Current HPI
- 230.0031
- Rent YoY
- —
- Metro
- Bridgeport-Stamford-Norwalk, CT
- State GDP YoY
- ▲ 1.06%
- F500 in state
- 38
Industry mix (Fortune 500 HQ in CT)
| Industry | F500 HQs | Revenue |
|---|---|---|
| Industrial Machinery | 4 | $38B |
|
||
| Insurance | 3 | $71B |
|
||
| Financial Services | 2 | $25B |
|
||
| Transportation / Logistics | 2 | $18B |
|
||
| Healthcare | 1 | $247B |
|
||
| Telecommunications | 1 | $55B |
|
||
Price history
1 event — show timeline
- 2026-06-11 Listed $505,000 Smart MLS
Property tax history
-0.2%/yrLatest (2023): $7,409 · +1.9% YoY. Source: county tax records.
Cash-flow waterfall
monthlySold comps — $/sqft
last 12 mo · ≤1 miLoading sold comps…