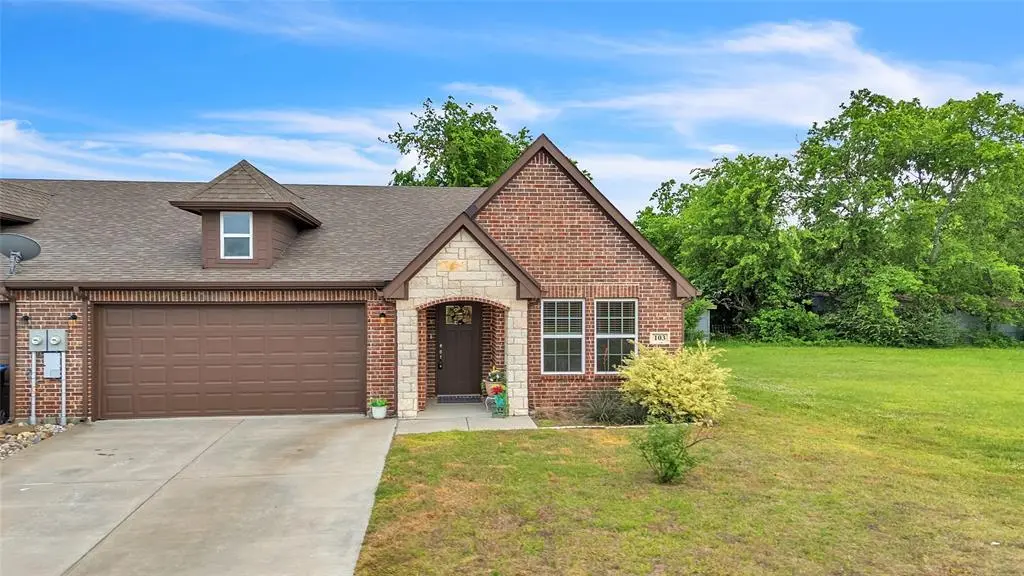
103 Tate Ln
Greenville, TX 75402
$239,900B-
3 bd · 2.0 ba ·
1,547 sqft ·
Built 2021
· MultiFamily
· Pending
· 22 DOM
Cashflow @ list (25.0% down · 7.5%)
Estimated rent
$3,423/mo
Mortgage (P&I)
−$1,258
Tax + insurance
−$583
HOA
−$0
Vac / Maint / Mgmt
−$719
Net cashflow
$864/mo
Annual
$10,362/yr
Cap rate
10.61%
Cash-on-cash
15.43%
DSCR
1.69
1% rule
1.43%
Cash to close
$67,172
Investor read
- This is a 3-bed/2.0-bath multifamily listed at $240k. Condition is rated good.
- At list price, monthly cash flow is $864 ($10k/yr) — positive.
- The deal already cash-flows at list — no discount required.
- Meets the 1% rule at list price ($3k rent vs $240k).
- It's been on market 22 days — a 2% lower offer ($236k) is reasonable based on typical stale-listing flexibility.
- Recommended offer: $236k (1.5% below list) — sets the bar for market timing.
- Local home prices are declining (-3.0%/yr); year-one equity from $2k of loan paydown is wiped out by about $7k of value loss. Plan a longer hold.
- Location reads 77/100 on livability (#78 in TX, #2,719 nationally) — a middle-class / working-renter tenant base. Strengths: cost of living A+, housing A+, health & safety A; Watch: employment D, commute F.
- Greenville ISD (town): math 20% / reading 26% proficiency, ranked #743 of 826 in TX (top 90%) — low school quality limits family demand, transient renter base, plan for 1-2y turnover.
- Zoned schools: Lamar El (math 28% / reading 33%, grade F, #2,464 of 4,322 statewide, top 58%, 554 students, 59% FRL) — zoned schools at 59% FRL track the district average.
- Market conditions: Rents soft (-1.0%/yr); 295 active listings in the ZIP; 38 comparable units currently listed for rent nearby; rentals at typical pace (median 25d on market — plan ~3-4 weeks tenant-placement turnaround); solid renter incomes; 1,289 units permitted in Hunt County in 2024 (527 in 5+ unit buildings).
- Hunt County population projected at +15% by 2050 — modest demand growth; plan on rents tracking national, not racing it.
- 3 sale attempts with the ask held roughly flat each time — persistent listings suggest the price (not the market) is what's stuck; bring a comps-based counter.
- Cap rate 10.6% vs local median 4.1% in Greenville — top-decile yield for the area; either an underpriced asset or a hidden risk that comps aren't pricing in. Stress-test before assuming the spread holds.
- At $3,423/mo this rent would consume 53% of the median local household income ($78k/yr) (locally 361% of renters already pay >50% of income on rent) — very limited rent-growth headroom before tenants either downsize or default.
Questions for listing agent
- Is there a deadline driving the sale (1031 exchange, divorce, estate, relocation)? That informs how much negotiation room exists.
- Schools are D-rated, which usually means shorter tenancies and higher turnover. Who's the typical renter profile here, and what's been the actual vacancy rate?
- What's the average days-on-market for RENTAL listings here right now (not sales)? A rising rental-DOM trend means longer vacancies and softer asking-rent achievability than the comps imply.
- What's the recent tenant-quality profile in this submarket — average credit score on applications, eviction rate, late-payment / NSF rate, and stable-employment percentage? A property-management company in the area should have these aggregated.
- How much new apartment / multifamily construction is in the pipeline within 1–3 miles? Heavy new supply (>2% of stock underway) typically softens rents 12–24 months out; light construction supports rent growth.
CashFlowRE · CFR-2ZQN6443YNKPCK
· Data 3 weeks ago
cashflowre.app · 2026-05-29