 Multi-family
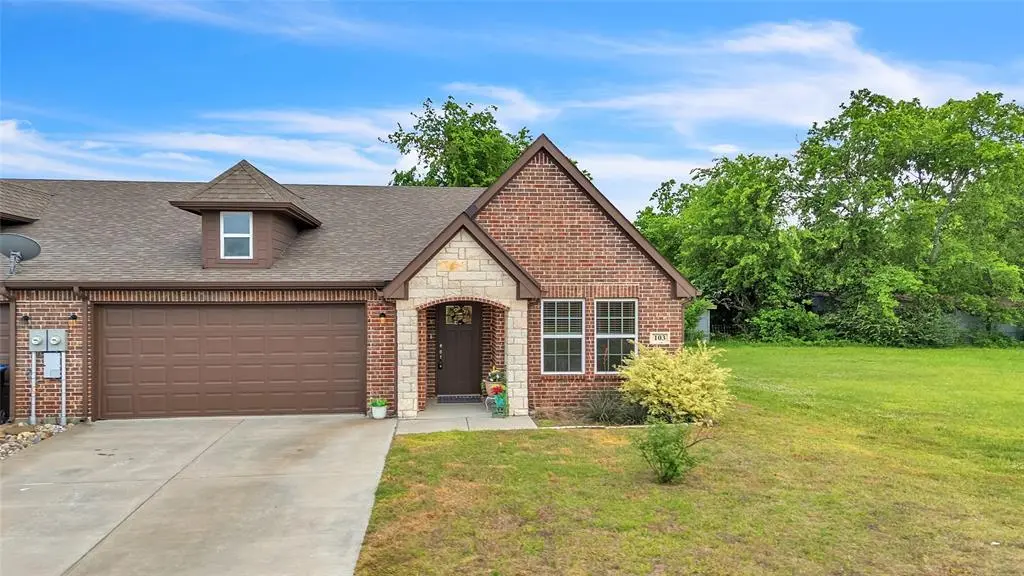
103 Tate Ln · Greenville, TX
Flood risk No data
- FEMA flood zone
- —
- Chance of flooding over 30 yrs
- —
- Est. flood insurance / yr
- —
Fire risk No data
- Est. fire insurance / yr
- —
Heat risk No data
- Hot days now (above threshold)
- —
- Hot days in 30 yrs
- —
Wind risk No data
- Chance of severe wind over 30 yrs
- —
Air-quality risk No data
- Unhealthy air days now
- —
- Unhealthy air days in 30 yrs
- —
Risk factors via First Street. Map © Google.
Why this score? — see what drove the B- grade
The composite is a weighted blend of 9 inputs, each scored 0–100. Each bar is that input's sub-score; the figure is the points it added to the 100-point composite (weight × sub-score).
- Cash flow +29.6/30.0
- DSCR +10.0/10.0
- 1% rule +9.3/10.0
- ARV discount +7.5/15.0
- Condition / age +4.0/5.0
- Livability +3.9/5.0
- Rent growth +2.2/5.0
- Schools +2.0/10.0
- Appreciation +0.0/10.0
$239,900
🖨 Deal sheet 📄 Offer letter ✓ Due diligence
Multi-family units
County records classify this as Multi-Family (2-4 Unit). Listing-text estimate: 1 unit. estimate disagrees with records
Listing remarks
Tucked at the end of a quiet cul-de-sac in Ellis Place, this 2021-built half duplex proves that low-maintenance living doesn’t mean sacrificing style or space. With over 1,500 sq ft, 3 bedrooms, and 2 full baths - this home is designed for real life and easy entertaining. Nearly new and move-in ready, this 2021-built home pairs modern finishes with an open, light-filled layout. The kitchen steals the show featuring granite countertops, a large island, stainless steel appliances, walk-in pantry, and seamless flow into the living and dining areas. Whether it’s a casual night in or hosting friends, this space delivers. The split-bedroom floorplan offers ideal privacy, with a spacio
Key facts
- Quiet cul-de-sac
- Modern finishes
- Large island
Tags
Property features AI
Finance
- Other: No municipal utility district; Dock not permitted; Washer, dryer, and refrigerator are excluded from the sale
- Financial info: Listing terms include Cash, Conventional, FHA, VA Loan, and 1031 Exchange
- HOA & community: No association (no HOA); Community features include curbs
Exterior
- Parking: 2 covered parking spaces; 2-car attached garage with double doors, garage faces front; Concrete driveway
- Security: Smoke detector(s)
- Utilities: City water; City sewer / sewer available; Electricity connected; Cable available; Curbs and all-weather/asphalt road access; Community mailbox
- Home design: Single-family residence; Residential property; Attached (property attached YN = Yes); Entry level: One story; Year built: 2021
- Construction: Brick, rock/stone, and siding exterior; Composition roof; Slab foundation
- Exterior features: Covered porch(es); Covered patio/porch; Gutters; Exterior lighting; Private yard; Wood fence in backyard; Adjacent to greenbelt; Located on a cul-de-sac; Cleared and grassed lot
Interior
- Kitchen: Dishwasher; Disposal; Electric cooktop; Electric oven; Microwave; Built-in cabinets; Farm sink; Granite countertops; Kitchen island; Pantry and walk-in pantry; Water line to refrigerator
- Bedrooms: 3 bedrooms (all on the main level); Primary bedroom with ensuite bath, dual sinks, separate shower, separate vanities, and walk-in closet; Two secondary bedrooms with split-bedroom layout and walk-in closets
- Flooring: Carpet; Ceramic tile; Luxury vinyl plank
- Bathrooms: 2 full bathrooms
- Heating & cooling: Central heating (electric); Central air; Ceiling fan(s)
- Interior features: Decorative lighting; Granite counters; Kitchen island; Open floorplan; Walk-in closet(s); Window coverings; One living area; One dining area; Total of 8 rooms; Levels: One
- Laundry & utility: Utility room with built-in cabinets and utility closet; Full-size washer/dryer area; Washer hookup; Electric dryer hookup; Separate mud room
Neighborhood map
What this means for you Summary
Snapshot
- This is a 3-bed/2.0-bath multifamily listed at $240k. Condition is rated good.
Deal economics
- At list price, monthly cash flow is $864 ($10k/yr) — positive.
- The deal already cash-flows at list — no discount required.
- Meets the 1% rule at list price ($3k rent vs $240k).
- Recommended offer: $236k (1.5% below list) — sets the bar for market timing.
- Cap rate 10.6% vs local median 4.1% in Greenville — top-decile yield for the area; either an underpriced asset or a hidden risk that comps aren't pricing in. Stress-test before assuming the spread holds.
Location & tenants
- Location reads 77/100 on livability (#78 in TX, #2,719 nationally) — a middle-class / working-renter tenant base. Strengths: cost of living A+, housing A+, health & safety A; Watch: employment D, commute F.
- Greenville ISD (town): math 20% / reading 26% proficiency, ranked #743 of 826 in TX (top 90%) — low school quality limits family demand, transient renter base, plan for 1-2y turnover.
- Zoned schools: Lamar El (math 28% / reading 33%, grade F, #2,464 of 4,322 statewide, top 58%, 554 students, 59% FRL) — zoned schools at 59% FRL track the district average.
- Market conditions: Rents soft (-1.0%/yr); 295 active listings in the ZIP; 38 comparable units currently listed for rent nearby; rentals at typical pace (median 24d on market — plan ~3-4 weeks tenant-placement turnaround); solid renter incomes; 1,289 units permitted in Hunt County in 2024 (527 in 5+ unit buildings).
- At $3,423/mo this rent would consume 53% of the median local household income ($78k/yr) (locally 361% of renters already pay >50% of income on rent) — very limited rent-growth headroom before tenants either downsize or default.
Forward outlook
- Local home prices are declining (-3.0%/yr); year-one equity from $2k of loan paydown is wiped out by about $7k of value loss. Plan a longer hold.
- Hunt County population projected at +15% by 2050 — modest demand growth; plan on rents tracking national, not racing it.
Negotiation context
- It's been on market 22 days — a 2% lower offer ($236k) is reasonable based on typical stale-listing flexibility.
- 3 sale attempts with the ask held roughly flat each time — persistent listings suggest the price (not the market) is what's stuck; bring a comps-based counter.
Questions for the listing agent
- Is there a deadline driving the sale (1031 exchange, divorce, estate, relocation)? That informs how much negotiation room exists.
- Schools are D-rated, which usually means shorter tenancies and higher turnover. Who's the typical renter profile here, and what's been the actual vacancy rate?
- What's the average days-on-market for RENTAL listings here right now (not sales)? A rising rental-DOM trend means longer vacancies and softer asking-rent achievability than the comps imply.
- What's the recent tenant-quality profile in this submarket — average credit score on applications, eviction rate, late-payment / NSF rate, and stable-employment percentage? A property-management company in the area should have these aggregated.
- How much new apartment / multifamily construction is in the pipeline within 1–3 miles? Heavy new supply (>2% of stock underway) typically softens rents 12–24 months out; light construction supports rent growth.
Investment metrics
- 1% rule
- 1.43% ✓
- Cap rate
- 10.61%
- Cash-on-cash
- 15.43%
- DSCR
- 1.69
- GRM
- 5.8
CMA / ARV
No comps found within radius.
Projected returns pro-forma
-3.0% appreciation · 0.0% rent growth · sell at horizon
- IRR
- 2.5%
- Equity multiple
- 1.09×
- Total profit
- $6,256
- Equity at exit
- $35,770
- IRR
- 8.7%
- Equity multiple
- 1.57×
- Total profit
- $38,165
- Equity at exit
- $20,742
Cash invested: $67,172 (down + closing). Projections, not guarantees.
Landlord ↔ Tenant lean methodology
- Overall (STATE)
- 87 Strongly Landlord-Friendly
- State Texas
- 87 Strongly Landlord-Friendly · R+5
- County
- — inherits STATE
- City
- — inherits STATE
ZIP-level market 75402
- Rents YoY
- -1.0%
- Active inventory
- 295
- Price-to-rent
- 11.7×
Monthly cashflow live
- Estimated rent
- $3,423 medium interval (Pro) →
- Mortgage (P&I)
- −$1,258
- Tax from tax record
- −$483 /mo · $5,792/yr
- Insurance
- −$100
- HOA
- −$0
- Vacancy / Maint / Mgmt
- −$719
- Net cashflow
- $864
Break-even live
2-unit breakdown (identical units grouped — click to expand)
| Units | Beds | Baths | Est. rent |
|---|---|---|---|
| 2× units | 3 | 2 | $3,422 |
| #1 | 3 | 2 | $1,711 |
| #2 | 3 | 2 | $1,711 |
| Total (2 units) | $3,423 | ||
UW: 25.0% down · 7.5% · 30yr · 1.5% tax · 5.0% vac · 8.0% maint · 8.0% mgmt
Financing live
Cash to close
- Down payment
- $59,975
- Closing costs
- $7,197
- Reserves months
- —
- Total cash needed
- —
Loan-product check · same deal, 3 products live
Conventional
25% down · 7.5% · 30yr
- Down + closing
- —
- Monthly P&I
- —
- Monthly cashflow
- —
- DSCR
- —
- Eligible?
- —
Personal DTI + credit; lowest rate.
DSCR
20% down · 8.5% · 30yr
- Down + closing
- —
- Monthly P&I
- —
- Monthly cashflow
- —
- DSCR
- —
- Eligible?
- —
No personal income docs; deal must DSCR.
Hard money
10% down · 12.0% · 12mo
- Down + closing
- —
- Monthly P&I
- —
- Monthly cashflow
- —
- DSCR
- —
- Eligible?
- —
Short-term bridge; refi at stabilization.
Rent comps 38 comps
| Address | Beds | Baths | Sqft | Rent | $/sqft | DOM | Units | Dist |
|---|---|---|---|---|---|---|---|---|
| 8511 Christie Ln Greenville, TX | 3.0 | 2.0 | 1547 | $1,895 | $1.22 | 24d | 1 | 0.06mi |
| 8507 Christie Ln Greenville, TX | 3.0 | 2.0 | 1581 | $1,875 | $1.19 | 20d | 1 | 0.08mi |
| 148 Frank St Greenville, TX | 3.0 | 2.0 | 1599 | $1,845 | $1.15 | 43d | 1 | 0.08mi |
| 8503 Christie Ln Greenville, TX | 3.0 | 2.0 | 1547 | $1,995 | $1.29 | 4d | 1 | 0.09mi |
| 706 Greyson Ln Greenville, TX | 3.0 | 2.0 | 1605 | $1,895 | $1.18 | 43d | 1 | 0.23mi |
| 703 Moseley Ln Greenville, TX | 3.0 | 2.0 | 1605 | $1,890 | $1.18 | 43d | 1 | 0.25mi |
| 111 Frank St Greenville, TX | 3.0 | 2.0 | 1605 | $1,800 | $1.12 | 16d | 1 | 0.26mi |
| 1001 Hardaway Dr Greenville, TX | 3.0 | 2.0 | 1596 | $1,850 | $1.16 | 2d | 1 | 0.34mi |
| 708 Hardaway Ln Greenville, TX | 3.0 | 2.0 | 1605 | $1,900 | $1.18 | 10d | 1 | 0.34mi |
| 1005 Hardaway Ln Greenville, TX | 3.0 | 2.0 | 1605 | $1,950 | $1.21 | 2d | 1 | 0.34mi |
| 802 Ransom Way Greenville, TX | 3.0 | 2.0 | 1605 | $1,900 | $1.18 | 2d | 1 | 0.39mi |
| 804 Ransom Way Greenville, TX | 3.0 | 2.0 | 1605 | $1,900 | $1.18 | 18d | 1 | 0.39mi |
| 109 Toma Hawk Dr Greenville, TX | 3.0 | 2.0 | 1657 | $1,900 | $1.15 | 12d | 1 | 0.41mi |
| 906 Tippit Ln Greenville, TX | 3.0 | 2.0 | 1605 | $1,900 | $1.18 | 2d | 1 | 0.45mi |
| 1017 Eva Dr Greenville, TX | 3.0 | 2.0 | 1582 | $1,450 | $0.92 | 43d | 1 | 0.48mi |
| 1012 Eva Dr Greenville, TX | 3.0 | 2.0 | 1582 | $1,895 | $1.20 | 24d | 1 | 0.51mi |
| 7804 Cottonwood Dr Greenville, TX | 3.0 | 2.0 | 1890 | $1,999 | $1.06 | 2d | 1 | 0.52mi |
| 601 Beechwood Dr Greenville, TX | 3.0 | 2.0 | 1890 | $1,825 | $0.97 | 24d | 1 | 0.52mi |
| 7806 Cottonwood Dr Greenville, TX | 3.0 | 2.0 | 1650 | $1,900 | $1.15 | 4d | 1 | 0.52mi |
| 7803 Cottonwood Dr Greenville, TX | 3.0 | 2.0 | 1621 | $1,900 | $1.17 | 43d | 1 | 0.56mi |
| 604 Sycamore Dr Greenville, TX | 3.0 | 2.0 | 1890 | $1,899 | $1.00 | 44d | 1 | 0.56mi |
| 6915 Justin Ln Greenville, TX | 3.0 | 2.0 | 1405 | $1,925 | $1.37 | 22d | 1 | 0.59mi |
| 7815 Cottonwood Dr Greenville, TX | 4.0 | 2.0 | 1718 | $1,900 | $1.11 | 24d | 1 | 0.60mi |
| 7814 Willow Ct Greenville, TX | 3.0 | 2.0 | 1890 | $2,095 | $1.11 | 7d | 1 | 0.63mi |
| 621 Redwood Dr Greenville, TX | 4.0 | 2.0 | 1710 | $2,150 | $1.26 | 43d | 1 | 0.64mi |
| 710 Teakwood Dr Greenville, TX | 4.0 | 2.0 | 1862 | $2,095 | $1.13 | 24d | 1 | 0.72mi |
| 6820 Topaz Dr Greenville, TX | 3.0 | 2.5 | 1819 | $900 | $0.49 | 43d | 1 | 0.74mi |
| 6809 Topaz Dr Greenville, TX | 3.0 | 3.0 | 2052 | $1,995 | $0.97 | 43d | 1 | 0.76mi |
| 1905 Center Point Ln Greenville, TX | 1.0–2.0 | 1.0–2.0 | 925 | $1,402 | $1.52 | 1d | 15 | 0.83mi |
| 512 Oakridge Dr Greenville, TX | 3.0 | 3.0 | 1695 | $1,700 | $1.00 | 43d | 1 | 0.92mi |
| 328 Jamie Way Greenville, TX | 3.0 | 2.0 | 1841 | $2,150 | $1.17 | 18d | 1 | 0.97mi |
| 2504 Paul St Greenville, TX | 4.0 | 2.0 | 1446 | $1,850 | $1.28 | 24d | 1 | 0.97mi |
| 6529 Graceland Dr Greenville, TX | 3.0 | 2.0 | 1702 | $1,875 | $1.10 | 24d | 1 | 1.10mi |
| 1426 Thibodaux Dr Greenville, TX | 3.0 | 2.0 | 1659 | $1,850 | $1.12 | 16d | 1 | 1.15mi |
| 3 Timberside Dr Greenville, TX | 3.0 | 2.0 | 1776 | $1,925 | $1.08 | 1d | 1 | 1.21mi |
| 2410 Jack Finney Blvd Greenville, TX | 1.0–3.0 | 1.0–2.0 | 943 | $1,680 | $1.78 | 1d | 8 | 1.21mi |
| 1401 Brindle Dr Greenville, TX | 3.0 | 2.0 | 1290 | $1,750 | $1.36 | 43d | 1 | 1.30mi |
| 1412 Waverley Dr Greenville, TX | 3.0 | 2.0 | 1333 | $1,650 | $1.24 | 43d | 1 | 1.38mi |
Listing history 12 events
-
2026-05-08status Pending
-
2026-04-29historical Active Option Contract
-
2026-04-13$239,900 Active
-
2026-03-19historical
-
2026-02-12price $264,900
-
2026-01-20price $274,900
-
2025-08-20price $279,900
-
2025-08-20status Active
-
2025-06-23status Pending
-
2025-06-20historical Active Option Contract
-
2025-04-13price $284,900
-
2025-03-06$289,900 Active
ⓘ Source: listings_history table (triggers on properties + properties_extension) + one-shot
backfill from property_details.listing_events for pre-trigger history.
Tax reassessment forecast TX · Resets to sale price
- Current annual tax
- $5,792 · $483/mo
- Projected year-2 tax
- $5,792 · $483/mo
- Expected delta
- $0/yr ($0/mo · 0.0%)
ⓘ Screening estimate from a state-policy table — verify with the county assessor before closing.
Nearby sold comps map
Loading sold comps map…
Walkable amenities ~0.75 mi
Loading nearby amenities…
Taxation est. · year 1
- Rental income
- $41,076
- − Mortgage interest
- −$13,438
- − Property taxes
- −$5,792
- − Insurance
- −$1,200
- − Repairs & maintenance
- −$3,286
- − Management
- −$3,286
- − Depreciation
- −$6,979
- Taxable income
- $7,096
- Est. tax owed @ 24.0%
- −$1,703
- After-tax cash flow
- $8,659/yr
For passive investors: Depreciation is non-cash, so a rental often shows a tax loss while cash-flowing — sheltering income. Rental losses are passive: they offset passive income freely, and up to $25,000/yr can offset ordinary (W-2) income if you actively participate and your MAGI is under $100k (phasing out to $0 by $150k); unused losses carry forward. On sale, claimed depreciation is recaptured at up to 25%, and gains may owe capital-gains tax (a 1031 exchange can defer both). Figures are a year-1 estimate at your 24.0% rate — not tax advice; consult a CPA.
Condition & rehab AI · 12 photos
This 2021-built half duplex is nearly new and move-in ready, featuring modern finishes and an open, light-filled layout.
Value-add opportunities
- Both Paint exterior trim — Enhances curb appeal and value
- Both Clean gutters — Improves drainage and property value
Renovation cost estimate screening
Value-add ROI direction
- Both Paint exterior trim — Enhances curb appeal and value ↑
- Both Clean gutters — Improves drainage and property value ↑
ⓘ Cost ranges are severity-bucket heuristics (US national rule-of-thumb). Get contractor quotes + a written scope before underwriting a rehab budget.
Schools (NCES district)
- District
- Greenville ISD
- NCES district ID
- 4821720
- Math proficiency
- 20% ▼ -12.00%
- Reading proficiency
- 26% ▼ -7.00%
- Median HH income
- $41,374
- Composite
- 19.56/100
- National rank
- #8759
- State rank
- #743 of 826 in TX
Livability — Greenville
- Score
- 77/100
- State rank
- #78
- US rank
- #2719
Category grades
Schools grade is shown separately in the Schools card above.
Census & demographics
- Census place
- Greenville, TX
- County
- Hunt County · 71,969 people
- City population
- 42,767
- Metro
- Dallas-Fort Worth-Arlington, TX
- Population (ZIP)
- 20,098
- Household income
- $77,877
- Rent vs Own
- Severe rent burden
- 361.0
Population outlook (Hunt County) Hauer SSP2
- Today (2025)
- 97,090 people
- By 2030
- 100,452 · +3.5%
- By 2040
- 106,544 · +9.7%
- By 2050
- 111,218 · +14.6%
- By 2075
- 121,695 · +25.3%
- By 2100
- 123,683 · +27.4%
Race, ethnicity, and origin ACS 2023
- Neighborhood character
- Predominantly White (74%)
- Race & ethnicity
- White 74% Hispanic / Latino 11% Black 10% Two or more races 8% Asian 2%
- Hispanic origin (detail)
- Mexican 7% Puerto Rican 1%
- Common ancestry
- Slovak 2% Romanian 2% Lithuanian 1%
- Foreign-born
- 3% · Canada, China
- Languages at home
- 93% English-only · Spanish 5% Chinese 1%
Political lean MEDSL · Hunt
- 2024 margin
- Solid R (+55.5) · D 21.9% · R 77.4%
- 2008→2024 swing
- -14.9pp toward R · 2008: -40.6pp · 2024: -55.5pp
- All cycles
- 2024: R+55.5 2020: R+52.5 2016: R+56.3 2012: R+51.2 2008: R+40.6
Not yet ingested
- Civics
- —
Market trends
- HPI YoY
- ▼ -141.52%
- Current HPI
- 232.0505
- Rent YoY
- ▼ -1.00%
- Metro
- Dallas-Fort Worth-Arlington, TX
- State GDP YoY
- ▲ 3.95%
- F500 in state
- 110
Industry mix (Fortune 500 HQ in TX)
| Industry | F500 HQs | Revenue |
|---|---|---|
| Energy | 16 | $1,198B |
|
||
| Technology | 5 | $198B |
|
||
| Engineering / Construction | 4 | $72B |
|
||
| Energy Services | 3 | $60B |
|
||
| Utilities | 3 | $41B |
|
||
| Healthcare | 2 | $330B |
|
||
Price history
-17.2% since first listed12 events — show timeline
- 2026-05-08 Pending — NTREIS
- 2026-04-29 Contingent — NTREIS
- 2026-04-13 Listed $239,900 NTREIS
- 2026-03-19 Listing Removed — NTREIS
- 2026-02-12 Price Changed $264,900 NTREIS
- 2026-01-20 Price Changed $274,900 NTREIS
- 2025-08-20 Price Changed $279,900 NTREIS
- 2025-08-20 Relisted — NTREIS
- 2025-06-23 Pending — NTREIS
- 2025-06-20 Contingent — NTREIS
- 2025-04-13 Price Changed $284,900 NTREIS
- 2025-03-06 Listed $289,900 NTREIS
Property tax history
+8.6%/yrLatest (2025): $5,792 · +4.0% YoY. Source: county tax records.
Cash-flow waterfall
monthlySold comps — $/sqft
last 12 mo · ≤1 miLoading sold comps…