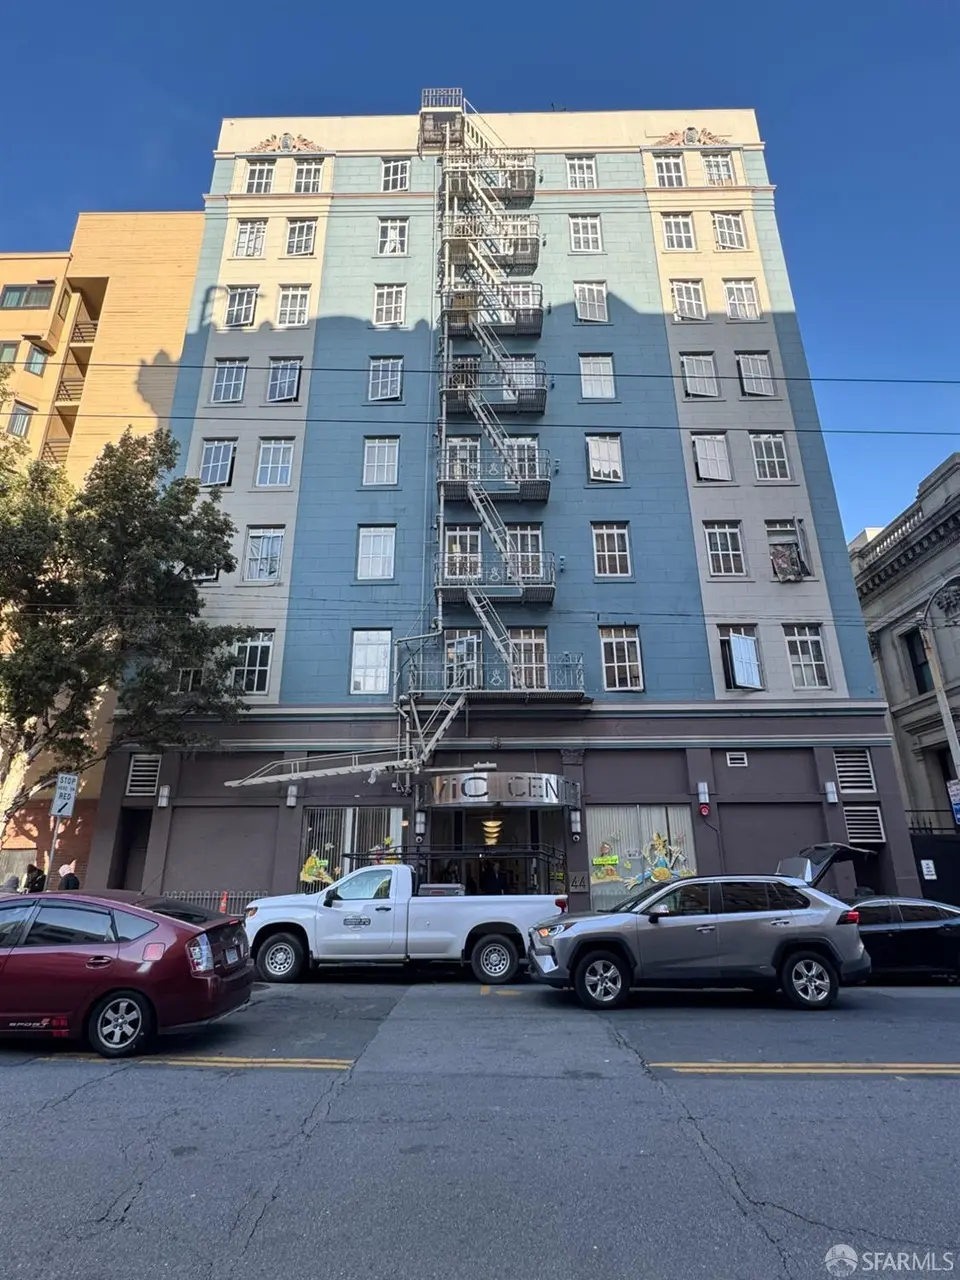
44 Mcallister St
San Francisco, CA 94102
$9,000,000C+
None bd · None ba ·
59,684 sqft ·
Built 1923
· MultiFamily
· Active
· 56 DOM
Cashflow @ list (25.0% down · 7.5%)
Estimated rent
$510,329/mo
Mortgage (P&I)
−$47,197
Tax + insurance
−$15,000
HOA
−$0
Vac / Maint / Mgmt
−$107,169
Net cashflow
$340,963/mo
Annual
$4,091,555/yr
Cap rate
51.75%
Cash-on-cash
162.36%
DSCR
8.22
1% rule
5.67%
Cash to close
$2,520,000
Investor read
- This is a multifamily listed at $9.00M.
- At list price, monthly cash flow is $341k ($4.09M/yr) — positive.
- The deal already cash-flows at list — no discount required.
- Meets the 1% rule at list price ($510k rent vs $9.00M).
- It's been on market 56 days — a 3% lower offer ($8.73M) is reasonable based on typical stale-listing flexibility.
- Recommended offer: $8.73M (3.0% below list) — sets the bar for market timing.
- In year one you build about $494k of equity ($62k loan paydown + $432k appreciation (4.8% local appreciation)).
- Location reads 76/100 on livability (#90 in CA, #3,143 nationally) — a middle-class / working-renter tenant base. Strengths: amenities A+, commute A+, employment A+; Watch: crime F, cost of living F.
- San Francisco Unified (urban): math 50% / reading 56% proficiency, ranked #322 of 1,400 in CA (top 23%) — acceptable for families but not a draw, mixed tenant base, ~2y average lease.
- Watch-outs: built in 1923 — expect roof / HVAC / electrical / plumbing capex.
- Market conditions: Rents rising fast (+10.1%/yr); 63 active listings in the ZIP; 750 units permitted in San Francisco County in 2024 (688 in 5+ unit buildings).
- San Francisco County population projected at +39% by 2050 — long-run rental-demand tailwind backs the buy-and-hold thesis.
- At projected returns (4.8% appreciation + 8.0% rent growth), your $2.52M cash investment doubles in ~1 year — after that, you're playing with house money.
- By year 2, paydown + projected appreciation supports a ~$793k cash-out refi (75% LTV) — recoverable capital for the next deal without selling this one.
- Cap rate 51.8% vs local median 2.1% in San Francisco — top-decile yield for the area; either an underpriced asset or a hidden risk that comps aren't pricing in. Stress-test before assuming the spread holds.
- At $510,329/mo this rent would consume 10134% of the median local household income ($60k/yr) (locally 3769% of renters already pay >50% of income on rent) — very limited rent-growth headroom before tenants either downsize or default.
Questions for listing agent
- It's been on market 56 days. Have you received any prior offers? Is the seller open to a 3% concession, seller financing, or rate buy-down credit?
- Built in 1923 — when were the roof, HVAC, electrical panel, plumbing, and water heater last replaced?
- Is there a deadline driving the sale (1031 exchange, divorce, estate, relocation)? That informs how much negotiation room exists.
- Schools are B-rated — typically a magnet for longer-tenancy family renters. What's the average tenant stay here, and is there a school-zone premium baked into asking?
- Crime grade is F in this area — have there been break-ins, vandalism, or insurance claims at this property in the last 3 years? What carrier currently insures it and at what premium?
- What's the average days-on-market for RENTAL listings here right now (not sales)? A rising rental-DOM trend means longer vacancies and softer asking-rent achievability than the comps imply.
- What's the recent tenant-quality profile in this submarket — average credit score on applications, eviction rate, late-payment / NSF rate, and stable-employment percentage? A property-management company in the area should have these aggregated.
- How much new apartment / multifamily construction is in the pipeline within 1–3 miles? Heavy new supply (>2% of stock underway) typically softens rents 12–24 months out; light construction supports rent growth.
CashFlowRE · CFR-307H9AFE5VRY5N
· Data 2 days ago
cashflowre.app · 2026-05-29