 🏷️ Likely Rental
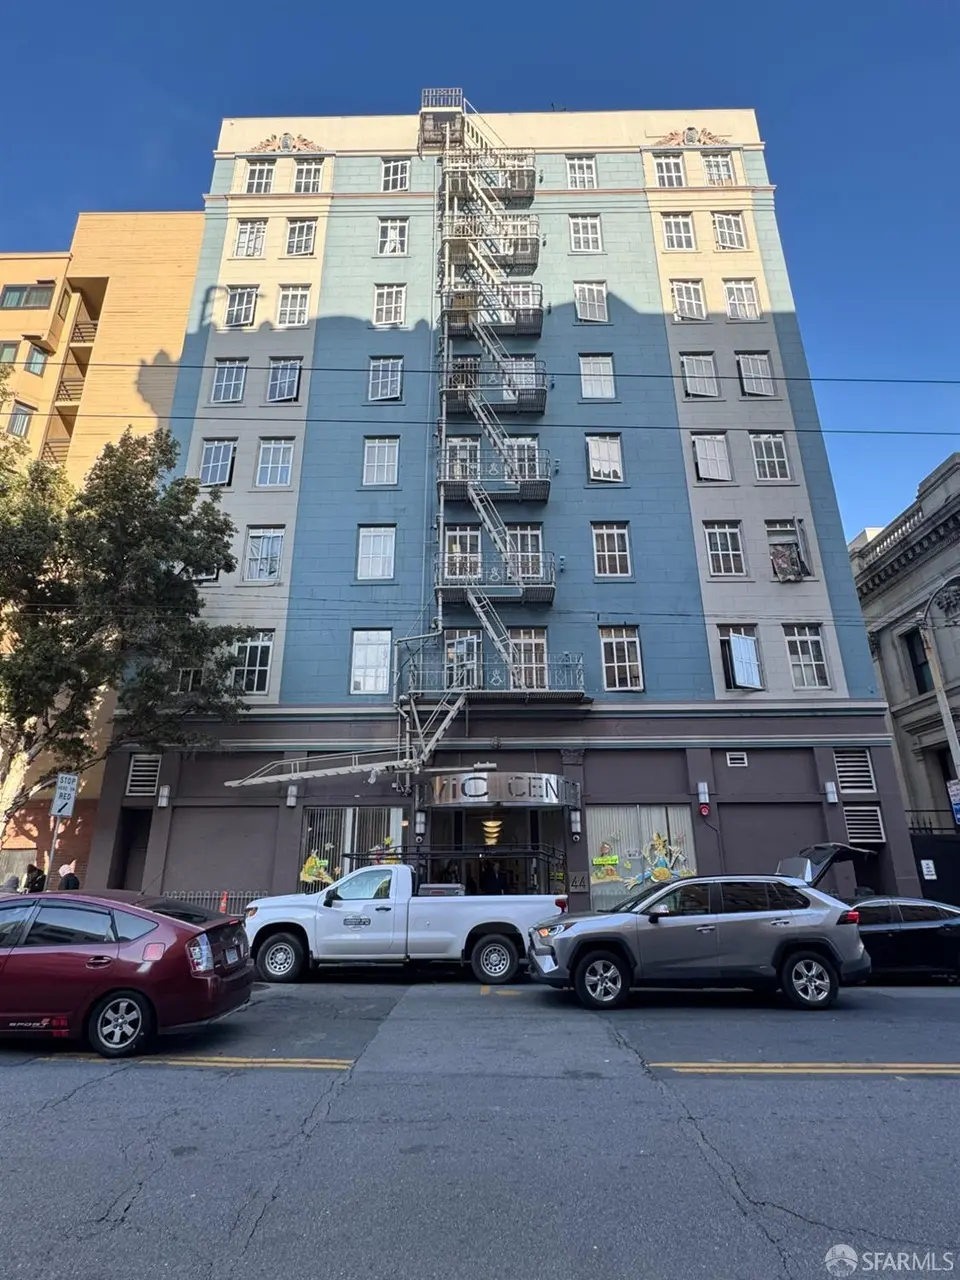
44 Mcallister St · San Francisco, CA
Flood risk 1/10 · Minimal
- FEMA flood zone
- X (unshaded)
- Chance of flooding over 30 yrs
- 0.0%
- Est. flood insurance / yr
- $507 – $1,088
Fire risk 1/10 · Minimal
- Est. fire insurance / yr
- $659 – $1,223
Heat risk 2/10 · Minimal
- Hot days now (above 79°F)
- 8 days/yr
- Hot days in 30 yrs
- 17 days/yr
Wind risk 1/10 · Minimal
- Chance of severe wind over 30 yrs
- —
Air-quality risk 8/10 · Major
- Unhealthy air days now
- 15 days/yr
- Unhealthy air days in 30 yrs
- 15 days/yr
Risk factors via First Street. Map © Google.
Why this score? — see what drove the C+ grade
The composite is a weighted blend of 9 inputs, each scored 0–100. Each bar is that input's sub-score; the figure is the points it added to the 100-point composite (weight × sub-score).
- Cash flow +15.0/30.0
- ARV discount +15.0/15.0
- Appreciation +7.4/10.0
- 1% rule +5.0/10.0
- DSCR +5.0/10.0
- Rent growth +5.0/5.0
- Schools +5.0/10.0
- Livability +3.8/5.0
- Condition / age +2.5/5.0
$9,000,000
🖨 Deal sheet 📄 Offer letter ✓ Due diligence
Multi-family units
County records classify this as Multi-Family (5+ Unit). Listing-text estimate: 1 unit. estimate disagrees with records
5+ unit building — per-unit beds/baths from public records are typically unavailable; the breakdown below (if shown) is an estimate from the listing text.
Listing remarks MLS
44 McAllister Street presents a rare opportunity to acquire a large-scale multifamily asset in the heart of San Francisco's Civic Center/Tenderloin neighborhood. The property consists of two hundred twelve (212) SRO units within a well-maintained, elevator-served building totaling approximately 59,684 square feet on a 9,473 square foot lot. Originally constructed in 1923, the building offers classic San Francisco architecture paired with efficient, functional layouts designed to support high-density urban living. The asset has historically operated as a supportive housing community, aligning with the mission of Civic Center Residence and providing stable, needs-based housing through a combination of tenant rents, government subsidies, and service-related income streams. This structure creates a reliable revenue base while also offering a future owner the flexibility to continue operating as supportive housing or reposition the asset over time. The property benefits from its central location just steps from Civic Center, Market Street, and multiple major transit corridors, providing immediate access to employment hubs, public transportation, and neighborhood-serving retail. The area continues to see significant public and private investment, reinforcing long-term demand for centrally located housing with convenient access to services and infrastructure. 44 McAllister Street offers investors a compelling combination of scale, in-place income, and operational upside. With a significant gap between current and market rents, as well as the opportunity to streamline expenses relative to historical operations, the property presents a clear path to increased cash flow and long-term value creation in one of San Francisco's most transit-oriented and supply-constrained rental markets.
Key facts
- Central location
- 9,474 sq ft lot
- Built 1923
Tags
Neighborhood map
What this means for you Summary
Snapshot
- This is a multifamily listed at $9.00M.
Deal economics
- At list price, monthly cash flow is $341k ($4.09M/yr) — positive.
- The deal already cash-flows at list — no discount required.
- Meets the 1% rule at list price ($510k rent vs $9.00M).
- Recommended offer: $8.73M (3.0% below list) — sets the bar for market timing.
- Cap rate 51.8% vs local median 2.1% in San Francisco — top-decile yield for the area; either an underpriced asset or a hidden risk that comps aren't pricing in. Stress-test before assuming the spread holds.
Location & tenants
- Location reads 76/100 on livability (#90 in CA, #3,143 nationally) — a middle-class / working-renter tenant base. Strengths: amenities A+, commute A+, employment A+; Watch: crime F, cost of living F.
- San Francisco Unified (urban): math 50% / reading 56% proficiency, ranked #322 of 1,400 in CA (top 23%) — acceptable for families but not a draw, mixed tenant base, ~2y average lease.
- Market conditions: Rents rising fast (+10.1%/yr); 63 active listings in the ZIP; 750 units permitted in San Francisco County in 2024 (688 in 5+ unit buildings).
- At $510,329/mo this rent would consume 10134% of the median local household income ($60k/yr) (locally 3769% of renters already pay >50% of income on rent) — very limited rent-growth headroom before tenants either downsize or default.
Forward outlook
- In year one you build about $494k of equity ($62k loan paydown + $432k appreciation (4.8% local appreciation)).
- San Francisco County population projected at +39% by 2050 — long-run rental-demand tailwind backs the buy-and-hold thesis.
- At projected returns (4.8% appreciation + 8.0% rent growth), your $2.52M cash investment doubles in ~1 year — after that, you're playing with house money.
- By year 2, paydown + projected appreciation supports a ~$793k cash-out refi (75% LTV) — recoverable capital for the next deal without selling this one.
Negotiation context
- It's been on market 56 days — a 3% lower offer ($8.73M) is reasonable based on typical stale-listing flexibility.
Risks & watch-outs
- Watch-outs: built in 1923 — expect roof / HVAC / electrical / plumbing capex.
Questions for the listing agent
- It's been on market 56 days. Have you received any prior offers? Is the seller open to a 3% concession, seller financing, or rate buy-down credit?
- Built in 1923 — when were the roof, HVAC, electrical panel, plumbing, and water heater last replaced?
- Is there a deadline driving the sale (1031 exchange, divorce, estate, relocation)? That informs how much negotiation room exists.
- Schools are B-rated — typically a magnet for longer-tenancy family renters. What's the average tenant stay here, and is there a school-zone premium baked into asking?
- Crime grade is F in this area — have there been break-ins, vandalism, or insurance claims at this property in the last 3 years? What carrier currently insures it and at what premium?
- What's the average days-on-market for RENTAL listings here right now (not sales)? A rising rental-DOM trend means longer vacancies and softer asking-rent achievability than the comps imply.
- What's the recent tenant-quality profile in this submarket — average credit score on applications, eviction rate, late-payment / NSF rate, and stable-employment percentage? A property-management company in the area should have these aggregated.
- How much new apartment / multifamily construction is in the pipeline within 1–3 miles? Heavy new supply (>2% of stock underway) typically softens rents 12–24 months out; light construction supports rent growth.
Investment metrics
- 1% rule
- 5.67% ✓
- Cap rate
- 51.75%
- Cash-on-cash
- 162.36%
- DSCR
- 8.22
- GRM
- 1.5
CMA / ARV
- ARV (median comp)
- $15,150,000
- List price
- $9,000,000
- Delta
- -40.59%
- Verdict
- UNDERPRICED
- Comps
- 3 within 1.0 mi
Projected returns pro-forma
4.8% appreciation · 8.0% rent growth · sell at horizon
- IRR
- —
- Equity multiple
- 11.47×
- Total profit
- $26,391,233
- Equity at exit
- $4,989,629
- IRR
- —
- Equity multiple
- 27.80×
- Total profit
- $67,543,142
- Equity at exit
- $8,521,376
Cash invested: $2,520,000 (down + closing). Projections, not guarantees.
Landlord ↔ Tenant lean methodology
- Overall (CITY)
- 0 Strongly Tenant-Friendly
- State California
- 18 Strongly Tenant-Friendly · D+13
- County
- — inherits STATE
- City San Francisco
- 0 Strongly Tenant-Friendly · D+57
ZIP-level market 94102
- Home prices YoY
- 2.7%
- Rents YoY
- 10.1%
- Active inventory
- 63
- Price-to-rent
- 311.6×
Monthly cashflow live
- Estimated rent
- $510,329 high interval (Pro) →
- Mortgage (P&I)
- −$47,197
- Tax est. 1.5%
- −$11,250 /mo · $135,000/yr
- Insurance
- −$3,750
- HOA
- −$0
- Vacancy / Maint / Mgmt
- −$107,169
- Net cashflow
- $340,963
Break-even live
212-unit breakdown (identical units grouped — click to expand)
| Units | Beds | Baths | Est. rent |
|---|---|---|---|
| 212× units | 1 | 1 | $510,284 |
| #1 | 1 | 1 | $2,407 |
| #2 | 1 | 1 | $2,407 |
| #3 | 1 | 1 | $2,407 |
| #4 | 1 | 1 | $2,407 |
| #5 | 1 | 1 | $2,407 |
| #6 | 1 | 1 | $2,407 |
| #7 | 1 | 1 | $2,407 |
| #8 | 1 | 1 | $2,407 |
| #9 | 1 | 1 | $2,407 |
| #10 | 1 | 1 | $2,407 |
| #11 | 1 | 1 | $2,407 |
| #12 | 1 | 1 | $2,407 |
| #13 | 1 | 1 | $2,407 |
| #14 | 1 | 1 | $2,407 |
| #15 | 1 | 1 | $2,407 |
| #16 | 1 | 1 | $2,407 |
| #17 | 1 | 1 | $2,407 |
| #18 | 1 | 1 | $2,407 |
| #19 | 1 | 1 | $2,407 |
| #20 | 1 | 1 | $2,407 |
| #21 | 1 | 1 | $2,407 |
| #22 | 1 | 1 | $2,407 |
| #23 | 1 | 1 | $2,407 |
| #24 | 1 | 1 | $2,407 |
| #25 | 1 | 1 | $2,407 |
| #26 | 1 | 1 | $2,407 |
| #27 | 1 | 1 | $2,407 |
| #28 | 1 | 1 | $2,407 |
| #29 | 1 | 1 | $2,407 |
| #30 | 1 | 1 | $2,407 |
| #31 | 1 | 1 | $2,407 |
| #32 | 1 | 1 | $2,407 |
| #33 | 1 | 1 | $2,407 |
| #34 | 1 | 1 | $2,407 |
| #35 | 1 | 1 | $2,407 |
| #36 | 1 | 1 | $2,407 |
| #37 | 1 | 1 | $2,407 |
| #38 | 1 | 1 | $2,407 |
| #39 | 1 | 1 | $2,407 |
| #40 | 1 | 1 | $2,407 |
| #41 | 1 | 1 | $2,407 |
| #42 | 1 | 1 | $2,407 |
| #43 | 1 | 1 | $2,407 |
| #44 | 1 | 1 | $2,407 |
| #45 | 1 | 1 | $2,407 |
| #46 | 1 | 1 | $2,407 |
| #47 | 1 | 1 | $2,407 |
| #48 | 1 | 1 | $2,407 |
| #49 | 1 | 1 | $2,407 |
| #50 | 1 | 1 | $2,407 |
| #51 | 1 | 1 | $2,407 |
| #52 | 1 | 1 | $2,407 |
| #53 | 1 | 1 | $2,407 |
| #54 | 1 | 1 | $2,407 |
| #55 | 1 | 1 | $2,407 |
| #56 | 1 | 1 | $2,407 |
| #57 | 1 | 1 | $2,407 |
| #58 | 1 | 1 | $2,407 |
| #59 | 1 | 1 | $2,407 |
| #60 | 1 | 1 | $2,407 |
| #61 | 1 | 1 | $2,407 |
| #62 | 1 | 1 | $2,407 |
| #63 | 1 | 1 | $2,407 |
| #64 | 1 | 1 | $2,407 |
| #65 | 1 | 1 | $2,407 |
| #66 | 1 | 1 | $2,407 |
| #67 | 1 | 1 | $2,407 |
| #68 | 1 | 1 | $2,407 |
| #69 | 1 | 1 | $2,407 |
| #70 | 1 | 1 | $2,407 |
| #71 | 1 | 1 | $2,407 |
| #72 | 1 | 1 | $2,407 |
| #73 | 1 | 1 | $2,407 |
| #74 | 1 | 1 | $2,407 |
| #75 | 1 | 1 | $2,407 |
| #76 | 1 | 1 | $2,407 |
| #77 | 1 | 1 | $2,407 |
| #78 | 1 | 1 | $2,407 |
| #79 | 1 | 1 | $2,407 |
| #80 | 1 | 1 | $2,407 |
| #81 | 1 | 1 | $2,407 |
| #82 | 1 | 1 | $2,407 |
| #83 | 1 | 1 | $2,407 |
| #84 | 1 | 1 | $2,407 |
| #85 | 1 | 1 | $2,407 |
| #86 | 1 | 1 | $2,407 |
| #87 | 1 | 1 | $2,407 |
| #88 | 1 | 1 | $2,407 |
| #89 | 1 | 1 | $2,407 |
| #90 | 1 | 1 | $2,407 |
| #91 | 1 | 1 | $2,407 |
| #92 | 1 | 1 | $2,407 |
| #93 | 1 | 1 | $2,407 |
| #94 | 1 | 1 | $2,407 |
| #95 | 1 | 1 | $2,407 |
| #96 | 1 | 1 | $2,407 |
| #97 | 1 | 1 | $2,407 |
| #98 | 1 | 1 | $2,407 |
| #99 | 1 | 1 | $2,407 |
| #100 | 1 | 1 | $2,407 |
| #101 | 1 | 1 | $2,407 |
| #102 | 1 | 1 | $2,407 |
| #103 | 1 | 1 | $2,407 |
| #104 | 1 | 1 | $2,407 |
| #105 | 1 | 1 | $2,407 |
| #106 | 1 | 1 | $2,407 |
| #107 | 1 | 1 | $2,407 |
| #108 | 1 | 1 | $2,407 |
| #109 | 1 | 1 | $2,407 |
| #110 | 1 | 1 | $2,407 |
| #111 | 1 | 1 | $2,407 |
| #112 | 1 | 1 | $2,407 |
| #113 | 1 | 1 | $2,407 |
| #114 | 1 | 1 | $2,407 |
| #115 | 1 | 1 | $2,407 |
| #116 | 1 | 1 | $2,407 |
| #117 | 1 | 1 | $2,407 |
| #118 | 1 | 1 | $2,407 |
| #119 | 1 | 1 | $2,407 |
| #120 | 1 | 1 | $2,407 |
| #121 | 1 | 1 | $2,407 |
| #122 | 1 | 1 | $2,407 |
| #123 | 1 | 1 | $2,407 |
| #124 | 1 | 1 | $2,407 |
| #125 | 1 | 1 | $2,407 |
| #126 | 1 | 1 | $2,407 |
| #127 | 1 | 1 | $2,407 |
| #128 | 1 | 1 | $2,407 |
| #129 | 1 | 1 | $2,407 |
| #130 | 1 | 1 | $2,407 |
| #131 | 1 | 1 | $2,407 |
| #132 | 1 | 1 | $2,407 |
| #133 | 1 | 1 | $2,407 |
| #134 | 1 | 1 | $2,407 |
| #135 | 1 | 1 | $2,407 |
| #136 | 1 | 1 | $2,407 |
| #137 | 1 | 1 | $2,407 |
| #138 | 1 | 1 | $2,407 |
| #139 | 1 | 1 | $2,407 |
| #140 | 1 | 1 | $2,407 |
| #141 | 1 | 1 | $2,407 |
| #142 | 1 | 1 | $2,407 |
| #143 | 1 | 1 | $2,407 |
| #144 | 1 | 1 | $2,407 |
| #145 | 1 | 1 | $2,407 |
| #146 | 1 | 1 | $2,407 |
| #147 | 1 | 1 | $2,407 |
| #148 | 1 | 1 | $2,407 |
| #149 | 1 | 1 | $2,407 |
| #150 | 1 | 1 | $2,407 |
| #151 | 1 | 1 | $2,407 |
| #152 | 1 | 1 | $2,407 |
| #153 | 1 | 1 | $2,407 |
| #154 | 1 | 1 | $2,407 |
| #155 | 1 | 1 | $2,407 |
| #156 | 1 | 1 | $2,407 |
| #157 | 1 | 1 | $2,407 |
| #158 | 1 | 1 | $2,407 |
| #159 | 1 | 1 | $2,407 |
| #160 | 1 | 1 | $2,407 |
| #161 | 1 | 1 | $2,407 |
| #162 | 1 | 1 | $2,407 |
| #163 | 1 | 1 | $2,407 |
| #164 | 1 | 1 | $2,407 |
| #165 | 1 | 1 | $2,407 |
| #166 | 1 | 1 | $2,407 |
| #167 | 1 | 1 | $2,407 |
| #168 | 1 | 1 | $2,407 |
| #169 | 1 | 1 | $2,407 |
| #170 | 1 | 1 | $2,407 |
| #171 | 1 | 1 | $2,407 |
| #172 | 1 | 1 | $2,407 |
| #173 | 1 | 1 | $2,407 |
| #174 | 1 | 1 | $2,407 |
| #175 | 1 | 1 | $2,407 |
| #176 | 1 | 1 | $2,407 |
| #177 | 1 | 1 | $2,407 |
| #178 | 1 | 1 | $2,407 |
| #179 | 1 | 1 | $2,407 |
| #180 | 1 | 1 | $2,407 |
| #181 | 1 | 1 | $2,407 |
| #182 | 1 | 1 | $2,407 |
| #183 | 1 | 1 | $2,407 |
| #184 | 1 | 1 | $2,407 |
| #185 | 1 | 1 | $2,407 |
| #186 | 1 | 1 | $2,407 |
| #187 | 1 | 1 | $2,407 |
| #188 | 1 | 1 | $2,407 |
| #189 | 1 | 1 | $2,407 |
| #190 | 1 | 1 | $2,407 |
| #191 | 1 | 1 | $2,407 |
| #192 | 1 | 1 | $2,407 |
| #193 | 1 | 1 | $2,407 |
| #194 | 1 | 1 | $2,407 |
| #195 | 1 | 1 | $2,407 |
| #196 | 1 | 1 | $2,407 |
| #197 | 1 | 1 | $2,407 |
| #198 | 1 | 1 | $2,407 |
| #199 | 1 | 1 | $2,407 |
| #200 | 1 | 1 | $2,407 |
| #201 | 1 | 1 | $2,407 |
| #202 | 1 | 1 | $2,407 |
| #203 | 1 | 1 | $2,407 |
| #204 | 1 | 1 | $2,407 |
| #205 | 1 | 1 | $2,407 |
| #206 | 1 | 1 | $2,407 |
| #207 | 1 | 1 | $2,407 |
| #208 | 1 | 1 | $2,407 |
| #209 | 1 | 1 | $2,407 |
| #210 | 1 | 1 | $2,407 |
| #211 | 1 | 1 | $2,407 |
| #212 | 1 | 1 | $2,407 |
| Total (212 units) | $510,329 | ||
UW: 25.0% down · 7.5% · 30yr · 1.5% tax · 5.0% vac · 8.0% maint · 8.0% mgmt
Financing live
Cash to close
- Down payment
- $2,250,000
- Closing costs
- $270,000
- Reserves months
- —
- Total cash needed
- —
Loan-product check · same deal, 3 products live
Conventional
25% down · 7.5% · 30yr
- Down + closing
- —
- Monthly P&I
- —
- Monthly cashflow
- —
- DSCR
- —
- Eligible?
- —
Personal DTI + credit; lowest rate.
DSCR
20% down · 8.5% · 30yr
- Down + closing
- —
- Monthly P&I
- —
- Monthly cashflow
- —
- DSCR
- —
- Eligible?
- —
No personal income docs; deal must DSCR.
Hard money
10% down · 12.0% · 12mo
- Down + closing
- —
- Monthly P&I
- —
- Monthly cashflow
- —
- DSCR
- —
- Eligible?
- —
Short-term bridge; refi at stabilization.
Listing history 15 events
-
2026-06-18days on market $9,000,000 Active 56 DOM
-
2026-06-17days on market $9,000,000 Active 55 DOM
-
2026-06-16days on market $9,000,000 Active 54 DOM
-
2026-06-15days on market $9,000,000 Active 53 DOM
-
2026-06-13days on market $9,000,000 Active 51 DOM
-
2026-06-13days on market $9,000,000 Active 50 DOM
-
2026-06-09days on market $9,000,000 Active 47 DOM
-
2026-06-08days on market $9,000,000 Active 46 DOM
-
2026-06-07days on market $9,000,000 Active 45 DOM
-
2026-06-04days on market $9,000,000 Active 42 DOM
-
2026-06-03days on market $9,000,000 Active 41 DOM
-
2026-06-02days on market $9,000,000 Active 40 DOM
-
2026-06-01days on market $9,000,000 Active 39 DOM
-
2026-05-31days on market $9,000,000 Active 38 DOM
-
2026-04-23$9,000,000 Active 1804-char remark
Show marketing remark (1804 chars)
44 McAllister Street presents a rare opportunity to acquire a large-scale multifamily asset in the heart of San Francisco's Civic Center/Tenderloin neighborhood. The property consists of two hundred twelve (212) SRO units within a well-maintained, elevator-served building totaling approximately 59,684 square feet on a 9,473 square foot lot. Originally constructed in 1923, the building offers classic San Francisco architecture paired with efficient, functional layouts designed to support high-density urban living. The asset has historically operated as a supportive housing community, aligning with the mission of Civic Center Residence and providing stable, needs-based housing through a combination of tenant rents, government subsidies, and service-related income streams. This structure creates a reliable revenue base while also offering a future owner the flexibility to continue operating as supportive housing or reposition the asset over time. The property benefits from its central location just steps from Civic Center, Market Street, and multiple major transit corridors, providing immediate access to employment hubs, public transportation, and neighborhood-serving retail. The area continues to see significant public and private investment, reinforcing long-term demand for centrally located housing with convenient access to services and infrastructure. 44 McAllister Street offers investors a compelling combination of scale, in-place income, and operational upside. With a significant gap between current and market rents, as well as the opportunity to streamline expenses relative to historical operations, the property presents a clear path to increased cash flow and long-term value creation in one of San Francisco's most transit-oriented and supply-constrained rental markets.
ⓘ Source: listings_history table (triggers on properties + properties_extension) + one-shot
backfill from property_details.listing_events for pre-trigger history.
Climate risk First Street
- Flood 1/10 Low FEMA zone X (unshaded) · 0% chance over 30 yrs
- Wildfire 1/10 Low
- Heat 2/10 Low 8 d/yr ≥79°F today · 17 d/yr by 30 yrs out
- Wind 1/10 Low
- Air quality 8/10 Severe 15 unhealthy d/yr today · 15 by 30 yrs out
Nearby sold comps map
Loading sold comps map…
Walkable amenities ~0.75 mi
Loading nearby amenities…
Taxation est. · year 1
- Rental income
- $6,123,948
- − Mortgage interest
- −$504,140
- − Property taxes
- −$135,000
- − Insurance
- −$45,000
- − Repairs & maintenance
- −$489,916
- − Management
- −$489,916
- − Depreciation
- −$261,818
- Taxable income
- $4,198,158
- Est. tax owed @ 24.0%
- −$1,007,558
- After-tax cash flow
- $3,083,997/yr
For passive investors: Depreciation is non-cash, so a rental often shows a tax loss while cash-flowing — sheltering income. Rental losses are passive: they offset passive income freely, and up to $25,000/yr can offset ordinary (W-2) income if you actively participate and your MAGI is under $100k (phasing out to $0 by $150k); unused losses carry forward. On sale, claimed depreciation is recaptured at up to 25%, and gains may owe capital-gains tax (a 1031 exchange can defer both). Figures are a year-1 estimate at your 24.0% rate — not tax advice; consult a CPA.
Schools (NCES district)
- District
- San Francisco Unified
- NCES district ID
- 0634410
- Math proficiency
- 50% ▬ 0.00%
- Reading proficiency
- 56% ▲ 1.00%
- Median HH income
- $81,249
- Composite
- 50.14/100
- National rank
- #4088
- State rank
- #322 of 1400 in CA
Livability — San Francisco
- Score
- 76/100
- State rank
- #90
- US rank
- #3143
Category grades
Schools grade is shown separately in the Schools card above.
Census & demographics
- Census place
- San Francisco, CA
- County
- San Francisco County · 827,552 people
- City population
- 827,552
- Metro
- San Francisco-Oakland-Berkeley, CA
- Population (ZIP)
- 35,976
- Household income
- $60,431
- Rent vs Own
- Severe rent burden
- 3769.0
Population outlook (San Francisco County) Hauer SSP2
- Today (2025)
- 1,030,936 people
- By 2030
- 1,110,409 · +7.7%
- By 2040
- 1,270,010 · +23.2%
- By 2050
- 1,435,001 · +39.2%
- By 2075
- 1,779,074 · +72.6%
- By 2100
- 1,966,767 · +90.8%
Race, ethnicity, and origin ACS 2023
- Neighborhood character
- Highly diverse neighborhood (Simpson 0.77)
- Race & ethnicity
- White 31% Asian 28% Hispanic / Latino 22% Two or more races 13% Black 9% Native American 2%
- Hispanic origin (detail)
- Mexican 15% Puerto Rican 1%
- Common ancestry
- Scotch-Irish 2% Romanian 2% Lithuanian 2%
- Foreign-born
- 41% · Canada, China, Vietnam
- Languages at home
- 52% English-only · Spanish 16% Chinese 10% Vietnamese 5%
Political lean MEDSL · San Francisco
- 2024 margin
- Solid D (+64.8) · D 80.3% · R 15.5% · Other 4.1%
- 2008→2024 swing
- -5.7pp toward R · 2008: 70.5pp · 2024: 64.8pp
- All cycles
- 2024: D+64.8 2020: D+72.5 2016: D+76.1 2012: D+70.2 2008: D+70.5
Not yet ingested
- Civics
- —
Market trends
- HPI YoY
- ▲ 4.80%
- Current HPI
- 184.4403
- Rent YoY
- ▲ 10.11%
- Metro
- San Francisco-Oakland-Berkeley, CA
- State GDP YoY
- ▲ 3.21%
- F500 in state
- 116
Industry mix (Fortune 500 HQ in CA)
| Industry | F500 HQs | Revenue |
|---|---|---|
| Technology | 27 | $1,492B |
|
||
| Financial Services | 3 | $174B |
|
||
| Retail | 3 | $44B |
|
||
| Insurance | 3 | $26B |
|
||
| Media / Entertainment | 2 | $115B |
|
||
| Pharmaceuticals / Biotech | 2 | $62B |
|
||
Price history
1 event — show timeline
- 2026-04-23 Listed $9,000,000 San Francisco MLS
Cash-flow waterfall
monthlySold comps — $/sqft
last 12 mo · ≤1 miLoading sold comps…