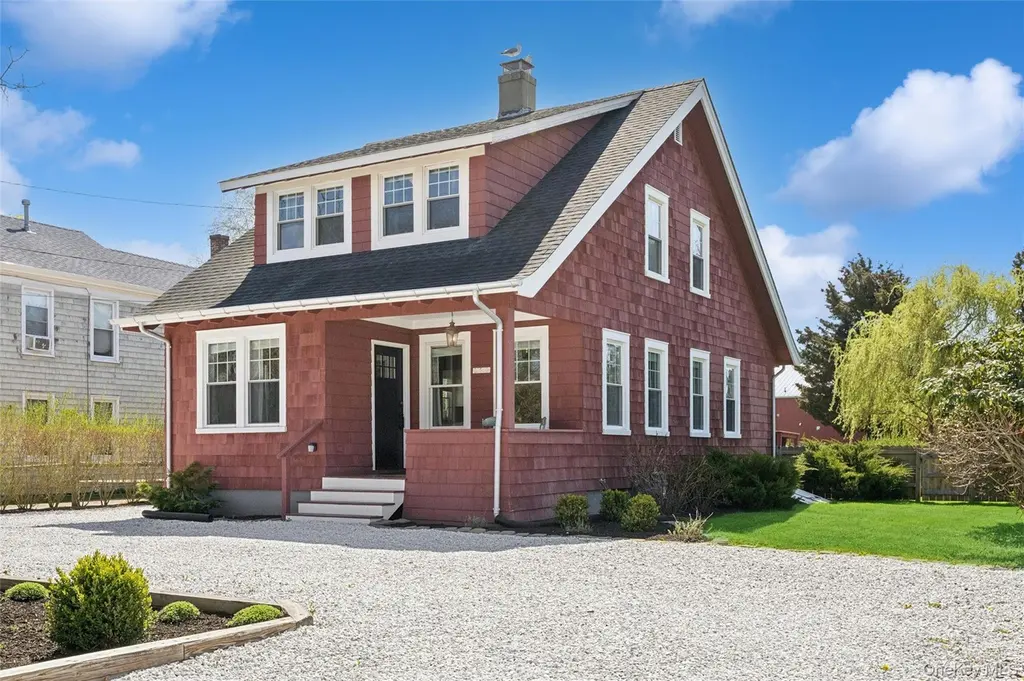
23530 Main Rd
Orient, NY 11957
$835,000A
3 bd · 2.0 ba ·
1,500 sqft ·
Built 1933
· SingleFamily
· Pending
· 50 DOM
Cashflow @ list (25.0% down · 7.5%)
Estimated rent
$13,226/mo
Mortgage (P&I)
−$4,379
Tax + insurance
−$635
HOA
−$0
Vac / Maint / Mgmt
−$2,777
Net cashflow
$5,434/mo
Annual
$65,214/yr
Cap rate
14.10%
Cash-on-cash
27.89%
DSCR
2.24
1% rule
1.58%
Cash to close
$233,800
Investor read
- This is a 3-bed/2.0-bath single-family listed at $835k.
- At list price, monthly cash flow is $5k ($65k/yr) — positive.
- The deal already cash-flows at list — no discount required.
- Meets the 1% rule at list price ($13k rent vs $835k).
- It's been on market 50 days — a 3% lower offer ($810k) is reasonable based on typical stale-listing flexibility.
- Recommended offer: $810k (3.0% below list) — sets the bar for market timing.
- In year one you build about $89k of equity ($6k loan paydown + $84k appreciation (10.0% local appreciation)).
- Location reads 57/100 on livability (#1,080 in NY) — a working-class tenant base; expect higher turnover. Strengths: crime A+, employment A+; Watch: amenities F, commute F, cost of living F.
- Oysterponds Union Free School District (rural): math 30% / reading 60% proficiency, ranked #506 of 755 in NY (top 67%) — families likely to look elsewhere, expect single-tenant / working-renter base with shorter leases; only 4% free/reduced lunch — higher-income household profile.
- Zoned schools: Oysterponds Elementary School (math 54% / reading 64%, grade B-, #745 of 2,108 statewide, top 39%, 80 students, 0% FRL) — zoned schools at 0% FRL track the district average.
- Zoned-school proficiency averages 60% at this address vs 45% district-wide (+14 pts) — the actual schools serving this property are materially stronger than the Oysterponds Union Free School District average implies; a family-tenant draw the district grade alone would hide.
- Watch-outs: built in 1933 — expect roof / HVAC / electrical / plumbing capex.
- Market conditions: 25 active listings in the ZIP; 2 comparable units currently listed for rent nearby; 1,366 units permitted in Suffolk County in 2024 (216 in 5+ unit buildings).
- Suffolk County population projected to shrink 5% by 2050 — rents likely to lag national; underwrite the cash flow, not the appreciation.
- 3 sale attempts since 7y ago; this cycle's ask has dropped $64k (7%) from the opening price — seller is motivated, your offer sets the floor, not the list.
- Current owner paid $420k; list at $835k implies a 99% gain — meaningful room to come down on a strong offer.
- At projected returns (10.0% appreciation + 3.0% rent growth), your $234k cash investment doubles in ~2 years — after that, you're playing with house money.
- By year 2, paydown + projected appreciation supports a ~$144k cash-out refi (75% LTV) — recoverable capital for the next deal without selling this one.
Questions for listing agent
- It's been on market 50 days. Have you received any prior offers? Is the seller open to a 3% concession, seller financing, or rate buy-down credit?
- Built in 1933 — when were the roof, HVAC, electrical panel, plumbing, and water heater last replaced?
- Is there a deadline driving the sale (1031 exchange, divorce, estate, relocation)? That informs how much negotiation room exists.
- What's the average days-on-market for RENTAL listings here right now (not sales)? A rising rental-DOM trend means longer vacancies and softer asking-rent achievability than the comps imply.
- What's the recent tenant-quality profile in this submarket — average credit score on applications, eviction rate, late-payment / NSF rate, and stable-employment percentage? A property-management company in the area should have these aggregated.
- How much new for-sale + rental construction is in the pipeline within 1–3 miles? Heavy new supply typically softens prices + rents 12–24 months out; constrained supply supports both.
CashFlowRE · CFR-32ANHKBVGRSZ3X
· Data 6 days ago
cashflowre.app · 2026-05-29