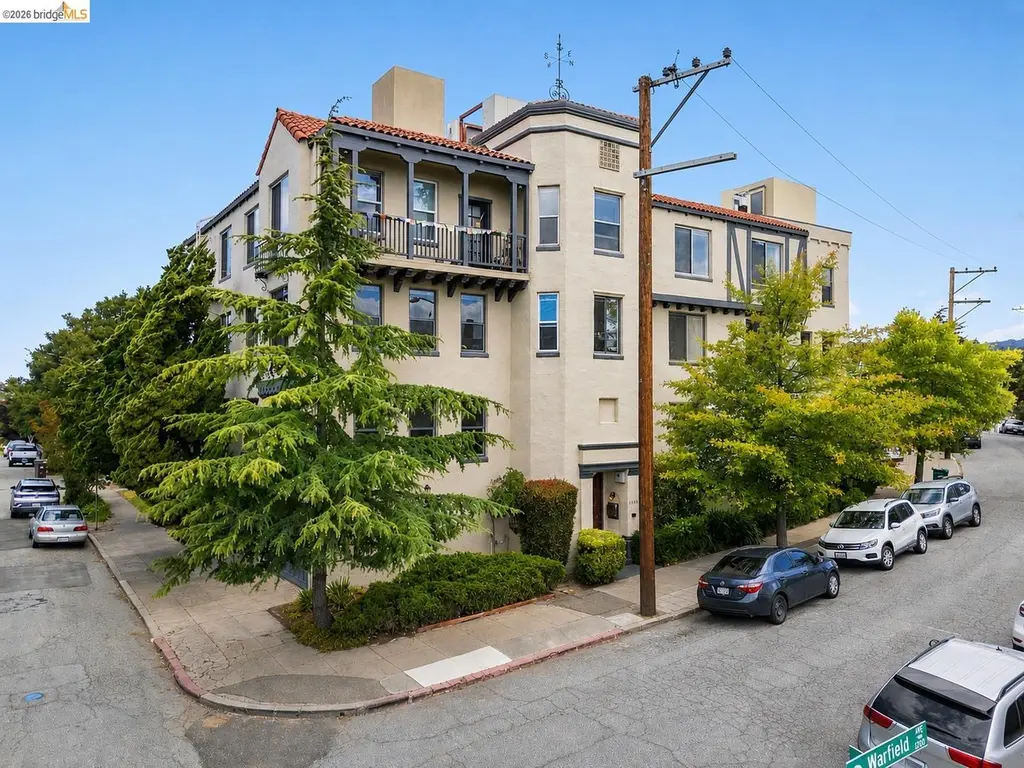
1001 Warfield Ave
Oakland, CA 94610
$3,165,000D
12 bd · 12.0 ba ·
12,176 sqft ·
Built 1928
· MultiFamily
· Active
· 25 DOM
Cashflow @ list (25.0% down · 7.5%)
Estimated rent
$28,549/mo
Mortgage (P&I)
−$16,598
Tax + insurance
−$6,087
HOA
−$0
Vac / Maint / Mgmt
−$5,995
Net cashflow
$-131/mo
Annual
$-1,569/yr
Cap rate
6.24%
Cash-on-cash
-0.18%
DSCR
0.99
1% rule
0.90%
Cash to close
$886,200
Investor read
- This is a 12 × 1-bed/1-bath units multifamily listed at $3.17M.
- At list price, monthly cash flow is $-131 ($-2k/yr) — negative. Per door: $-11/mo.
- To cash-flow at today's rent, offer at most $3.14M (0.7% below list).
- To meet the 1% rule (rent ≥ 1% of price), the offer needs to be $2.85M (9.8% below list).
- It's been on market 25 days — a 2% lower offer ($3.12M) is reasonable based on typical stale-listing flexibility.
- Recommended offer: $2.85M (9.8% below list) — sets the bar for 1% rule.
- Local home prices are declining (-3.0%/yr); year-one equity from $22k of loan paydown is wiped out by about $95k of value loss. Plan a longer hold.
- Location reads 71/100 on livability (#224 in CA) — a middle-class / working-renter tenant base. Strengths: amenities A+, commute A+, employment A+; Watch: crime F, cost of living F.
- Oakland Unified (urban): math 27% / reading 33% proficiency, ranked #1,007 of 1,400 in CA (top 72%) — families likely to look elsewhere, expect single-tenant / working-renter base with shorter leases; 68% free/reduced lunch — lower-income household profile, screen leases tightly.
- Zoned schools: Cleveland Elementary (371 students, 51% FRL); Westlake Middle (314 students, 87% FRL); Oakland Technical High (1,796 students, 57% FRL) — zoned schools at 65% FRL track the district average.
- Watch-outs: built in 1928 — expect roof / HVAC / electrical / plumbing capex.
- Market conditions: Rents rising (+3.3%/yr); 111 active listings in the ZIP; high-income renter base; 1,742 units permitted in Alameda County in 2024 (856 in 5+ unit buildings).
- Alameda County population projected at +34% by 2050 — long-run rental-demand tailwind backs the buy-and-hold thesis.
- Cap rate 6.2% vs local median 2.5% in Oakland — top-decile yield for the area; either an underpriced asset or a hidden risk that comps aren't pricing in. Stress-test before assuming the spread holds.
- At $28,549/mo this rent would consume 255% of the median local household income ($135k/yr) (locally 1614% of renters already pay >50% of income on rent) — very limited rent-growth headroom before tenants either downsize or default.
Questions for listing agent
- What do current leases actually rent for vs. the listed asking? Can we see a recent rent roll and the last 12 months of T-12 income?
- Can we see the unit-by-unit rent roll, current vacancy, and any below-market leases? What's the average tenancy length?
- What capital expenditures (roof, boiler, parking lot, exteriors) have been made in the last 5 years, and what's planned in the next 2?
- Built in 1928 — when were the roof, HVAC, electrical panel, plumbing, and water heater last replaced?
- Is there a deadline driving the sale (1031 exchange, divorce, estate, relocation)? That informs how much negotiation room exists.
- Crime grade is F in this area — have there been break-ins, vandalism, or insurance claims at this property in the last 3 years? What carrier currently insures it and at what premium?
- The area grade is low — what's the realistic commute time and amenity access for the typical tenant pool here? Any planned neighborhood developments (good or bad) we should know about?
- What's the average days-on-market for RENTAL listings here right now (not sales)? A rising rental-DOM trend means longer vacancies and softer asking-rent achievability than the comps imply.
CashFlowRE · CFR-32QATQ92VAJHEY
· Data 5 h ago
cashflowre.app · 2026-05-29