 12-Plex
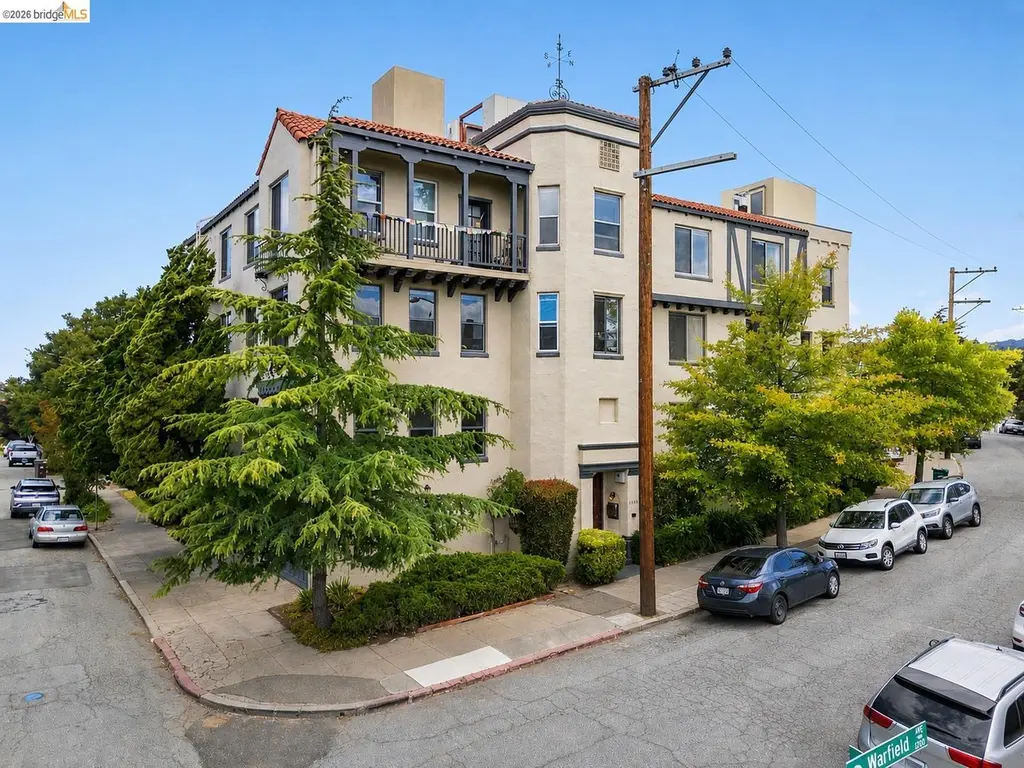
1001 Warfield Ave · Oakland, CA
Flood risk 1/10 · Minimal
- FEMA flood zone
- X (unshaded)
- Chance of flooding over 30 yrs
- 0.0%
- Est. flood insurance / yr
- $507 – $1,088
Fire risk 1/10 · Minimal
- Est. fire insurance / yr
- $659 – $1,223
Heat risk 3/10 · Minor
- Hot days now (above 84°F)
- 7 days/yr
- Hot days in 30 yrs
- 15 days/yr
Wind risk 1/10 · Minimal
- Chance of severe wind over 30 yrs
- —
Air-quality risk 8/10 · Major
- Unhealthy air days now
- 14 days/yr
- Unhealthy air days in 30 yrs
- 14 days/yr
Risk factors via First Street. Map © Google.
Why this score? — see what drove the D grade
The composite is a weighted blend of 9 inputs, each scored 0–100. Each bar is that input's sub-score; the figure is the points it added to the 100-point composite (weight × sub-score).
- Cash flow +13.1/30.0
- ARV discount +7.5/15.0
- 1% rule +4.0/10.0
- DSCR +3.9/10.0
- Livability +3.6/5.0
- Rent growth +3.3/5.0
- Schools +3.0/10.0
- Condition / age +2.5/5.0
- Appreciation +0.0/10.0
$3,165,000
🖨 Deal sheet (PDF) 📄 Offer letter ✓ Due diligence
Multi-family units
County records classify this as Multi-Family (5+ Unit). Listing-text estimate: 12 units. confirmed
5+ unit building — per-unit beds/baths from public records are typically unavailable; the breakdown below (if shown) is an estimate from the listing text.
Listing remarks
1001 Warfield Avenue is a 12-unit apartment building located in one of Oakland’s most desirable neighborhoods. The property consists of eleven (11) large, one-bedroom, one-bathroom units and one (1) large, studio unit, averaging approximately 900 square feet. Positioned on a corner lot, the ±12,176 square foot building provides investors with strong in-place income and additional upside through continued unit turnover and rental growth. The property features 9-foot-plus ceilings, period-appropriate architectural details including beamed ceilings and original built-ins, along with generous living, dining, and bedroom spaces that enhance tenant appeal and long-term desirability.
Key facts
- 9 foot plus ceilings
- On site laundry room
- Beamed ceilings
Tags
Property features AI
Finance
- Financial info: 12 total units; Cap rate 6.13%
Exterior
- Parking: 9 parking spaces; Detached, enclosed parking
- Utilities: Storage tank water source; Public sewer; Individual electric meter; Individual gas meter
- Home design: Lowrise (1–3 floors) commercial multi-unit property; Built in 1928
- Construction: Stucco construction; Composition roof; Built in 1928
- Exterior features: Corner lot
Interior
- Flooring: Hardwood; Partial carpeting
- Heating & cooling: Electric heating
- Interior features: Storage
- Laundry & utility: Washer; Dryer
Neighborhood map
What this means for you Summary
Snapshot
- This is a 12 × 1-bed/1-bath units multifamily listed at $3.17M.
Deal economics
- At list price, monthly cash flow is $-128 ($-2k/yr) — negative. Per door: $-11/mo.
- To cash-flow at today's rent, offer at most $3.14M (0.7% below list).
- To meet the 1% rule (rent ≥ 1% of price), the offer needs to be $2.86M (9.8% below list).
- Recommended offer: $2.86M (9.8% below list) — sets the bar for 1% rule.
- Cap rate 6.2% vs local median 2.5% in Oakland — top-decile yield for the area; either an underpriced asset or a hidden risk that comps aren't pricing in. Stress-test before assuming the spread holds.
Location & tenants
- Location reads 71/100 on livability (#224 in CA) — a middle-class / working-renter tenant base. Strengths: amenities A+, commute A+, employment A+; Watch: crime F, cost of living F.
- Oakland Unified (urban): math 27% / reading 33% proficiency, ranked #1,007 of 1,400 in CA (top 72%) — families likely to look elsewhere, expect single-tenant / working-renter base with shorter leases; 68% free/reduced lunch — lower-income household profile, screen leases tightly.
- Zoned schools: Cleveland Elementary (371 students, 51% FRL); Westlake Middle (314 students, 87% FRL); Oakland Technical High (1,796 students, 57% FRL) — zoned schools at 65% FRL track the district average.
- Market conditions: Rents rising (+3.3%/yr); 111 active listings in the ZIP; high-income renter base; 1,742 units permitted in Alameda County in 2024 (856 in 5+ unit buildings).
- At $28,553/mo this rent would consume 255% of the median local household income ($135k/yr) (locally 1614% of renters already pay >50% of income on rent) — very limited rent-growth headroom before tenants either downsize or default.
Forward outlook
- Local home prices are declining (-3.0%/yr); year-one equity from $22k of loan paydown is wiped out by about $95k of value loss. Plan a longer hold.
- Alameda County population projected at +34% by 2050 — long-run rental-demand tailwind backs the buy-and-hold thesis.
Negotiation context
- It's been on market 25 days — a 2% lower offer ($3.12M) is reasonable based on typical stale-listing flexibility.
Risks & watch-outs
- Watch-outs: built in 1928 — expect roof / HVAC / electrical / plumbing capex.
Questions for the listing agent
- What do current leases actually rent for vs. the listed asking? Can we see a recent rent roll and the last 12 months of T-12 income?
- Can we see the unit-by-unit rent roll, current vacancy, and any below-market leases? What's the average tenancy length?
- What capital expenditures (roof, boiler, parking lot, exteriors) have been made in the last 5 years, and what's planned in the next 2?
- Built in 1928 — when were the roof, HVAC, electrical panel, plumbing, and water heater last replaced?
- Is there a deadline driving the sale (1031 exchange, divorce, estate, relocation)? That informs how much negotiation room exists.
- Crime grade is F in this area — have there been break-ins, vandalism, or insurance claims at this property in the last 3 years? What carrier currently insures it and at what premium?
- The area grade is low — what's the realistic commute time and amenity access for the typical tenant pool here? Any planned neighborhood developments (good or bad) we should know about?
- What's the average days-on-market for RENTAL listings here right now (not sales)? A rising rental-DOM trend means longer vacancies and softer asking-rent achievability than the comps imply.
- What's the recent tenant-quality profile in this submarket — average credit score on applications, eviction rate, late-payment / NSF rate, and stable-employment percentage? A property-management company in the area should have these aggregated.
- How much new apartment / multifamily construction is in the pipeline within 1–3 miles? Heavy new supply (>2% of stock underway) typically softens rents 12–24 months out; light construction supports rent growth.
Investment metrics
- 1% rule
- 0.90% ✗
- Cap rate
- 6.24%
- Cash-on-cash
- -0.17%
- DSCR
- 0.99
- GRM
- 9.2
CMA / ARV
No comps found within radius.
Projected returns pro-forma
-3.0% appreciation · 3.34% rent growth · sell at horizon
- IRR
- -16.2%
- Equity multiple
- 0.42×
- Total profit
- $-510,263
- Equity at exit
- $471,912
- IRR
- -7.2%
- Equity multiple
- 0.54×
- Total profit
- $-410,520
- Equity at exit
- $273,651
Cash invested: $886,200 (down + closing). Projections, not guarantees.
Landlord ↔ Tenant lean methodology
- Overall (CITY)
- 0 Strongly Tenant-Friendly
- State California
- 18 Strongly Tenant-Friendly · D+13
- County
- — inherits STATE
- City Oakland
- 0 Strongly Tenant-Friendly · D+62
ZIP-level market 94610
- Rents YoY
- 3.3%
- Active inventory
- 111
- Price-to-rent
- 110.8×
Monthly cashflow live
- Estimated rent
- $28,553 high interval (Pro) →
- Mortgage (P&I)
- −$16,598
- Tax from tax record
- −$4,768 /mo · $57,218/yr
- Insurance
- −$1,319
- HOA
- −$0
- Lot rent
- −$0
- Vacancy / Maint / Mgmt
- −$5,996
- Net cashflow
- $-128
Break-even live
Sensitivity live
| Price | -10% $1,664 | -5% $768 | +0% $-128 | +5% $-1,023 | +10% $-1,919 |
|---|---|---|---|---|---|
| Rent | -10% $-2,383 | -5% $-1,255 | +0% $-128 | +5% $1,000 | +10% $2,128 |
| Rate | -1.0pp $1,466 | -0.5pp $677 | base $-128 | +0.5pp $-948 | +1.0pp $-1,782 |
12-unit breakdown (identical units grouped — click to expand)
| Units | Beds | Baths | Est. rent |
|---|---|---|---|
| 12× units | 1 | 1 | $28,548 |
| #1 | 1 | 1 | $2,379 |
| #2 | 1 | 1 | $2,379 |
| #3 | 1 | 1 | $2,379 |
| #4 | 1 | 1 | $2,379 |
| #5 | 1 | 1 | $2,379 |
| #6 | 1 | 1 | $2,379 |
| #7 | 1 | 1 | $2,379 |
| #8 | 1 | 1 | $2,379 |
| #9 | 1 | 1 | $2,379 |
| #10 | 1 | 1 | $2,379 |
| #11 | 1 | 1 | $2,379 |
| #12 | 1 | 1 | $2,379 |
| Total (12 units) | $28,553 | ||
UW: 25.0% down · 7.5% · 30yr · 1.5% tax · 5.0% vac · 8.0% maint · 8.0% mgmt
Financing live
Cash to close
- Down payment
- $791,250
- Closing costs
- $94,950
- Reserves months
- —
- Total cash needed
- —
Loan-product check · same deal, 3 products live
Conventional
25% down · 7.5% · 30yr
- Down + closing
- —
- Monthly P&I
- —
- Monthly cashflow
- —
- DSCR
- —
- Eligible?
- —
Personal DTI + credit; lowest rate.
DSCR
20% down · 8.5% · 30yr
- Down + closing
- —
- Monthly P&I
- —
- Monthly cashflow
- —
- DSCR
- —
- Eligible?
- —
No personal income docs; deal must DSCR.
Hard money
10% down · 12.0% · 12mo
- Down + closing
- —
- Monthly P&I
- —
- Monthly cashflow
- —
- DSCR
- —
- Eligible?
- —
Short-term bridge; refi at stabilization.
Listing history 17 events
-
2026-06-22days on market $3,165,000 Active 25 DOM
-
2026-06-21days on market $3,165,000 Active 24 DOM
-
2026-06-18days on market $3,165,000 Active 21 DOM
-
2026-06-17days on market $3,165,000 Active 20 DOM
-
2026-06-16days on market $3,165,000 Active 19 DOM
-
2026-06-15days on market $3,165,000 Active 18 DOM
-
2026-06-13days on market $3,165,000 Active 16 DOM
-
2026-06-13days on market $3,165,000 Active 15 DOM
-
2026-06-09days on market $3,165,000 Active 12 DOM
-
2026-06-08days on market $3,165,000 Active 11 DOM
-
2026-06-07days on market $3,165,000 Active 10 DOM
-
2026-06-04days on market $3,165,000 Active 7 DOM
-
2026-06-03days on market $3,165,000 Active 6 DOM
-
2026-06-02days on market $3,165,000 Active 5 DOM
-
2026-06-01days on market $3,165,000 Active 4 DOM
-
2026-05-31days on market $3,165,000 Active 3 DOM
-
2026-05-28$3,165,000 Active
ⓘ Source: listings_history table (triggers on properties + properties_extension) + one-shot
backfill from property_details.listing_events for pre-trigger history.
Tax reassessment forecast CA · Resets to sale price
- Current annual tax
- $57,218 · $4,768/mo
- Projected year-2 tax
- $57,218 · $4,768/mo
- Expected delta
- $0/yr ($0/mo · 0.0%)
ⓘ Screening estimate from a state-policy table — verify with the county assessor before closing.
Climate risk First Street
- Flood 1/10 Low FEMA zone X (unshaded) · 0% chance over 30 yrs
- Wildfire 1/10 Low
- Heat 3/10 Moderate 7 d/yr ≥84°F today · 15 d/yr by 30 yrs out
- Wind 1/10 Low
- Air quality 8/10 Severe 14 unhealthy d/yr today · 14 by 30 yrs out
Nearby sold comps map
Loading sold comps map…
Walkable amenities ~0.75 mi
Loading nearby amenities…
Taxation est. · year 1
- Rental income
- $342,636
- − Mortgage interest
- −$177,289
- − Property taxes
- −$57,218
- − Insurance
- −$15,825
- − Repairs & maintenance
- −$27,411
- − Management
- −$27,411
- − Depreciation
- −$92,073
- Taxable loss
- −$54,590
- Est. tax savings @ 24.0%
- +$13,102
- After-tax cash flow
- $11,570/yr
For passive investors: Depreciation is non-cash, so a rental often shows a tax loss while cash-flowing — sheltering income. Rental losses are passive: they offset passive income freely, and up to $25,000/yr can offset ordinary (W-2) income if you actively participate and your MAGI is under $100k (phasing out to $0 by $150k); unused losses carry forward. On sale, claimed depreciation is recaptured at up to 25%, and gains may owe capital-gains tax (a 1031 exchange can defer both). Figures are a year-1 estimate at your 24.0% rate — not tax advice; consult a CPA.
Schools (NCES district)
- District
- Oakland Unified
- NCES district ID
- 0628050
- Math proficiency
- 27% ▬ 0.00%
- Reading proficiency
- 33% ▬ 0.00%
- Median HH income
- $55,194
- Composite
- 29.52/100
- National rank
- #11769
- State rank
- #1007 of 1400 in CA
Livability — Oakland
- Score
- 71/100
- State rank
- #224
- US rank
- #7245
Category grades
Schools grade is shown separately in the Schools card above.
Census & demographics
- Census place
- Oakland, CA
- County
- Alameda County · 1,614,355 people
- City population
- 385,993
- Metro
- San Francisco-Oakland-Berkeley, CA
- Population (ZIP)
- 32,628
- Household income
- $134,507
- Rent vs Own
- Severe rent burden
- 1614.0
Population outlook (Alameda County) Hauer SSP2
- Today (2025)
- 1,928,884 people
- By 2030
- 2,069,146 · +7.3%
- By 2040
- 2,338,405 · +21.2%
- By 2050
- 2,586,608 · +34.1%
- By 2075
- 3,061,911 · +58.7%
- By 2100
- 3,234,133 · +67.7%
Race, ethnicity, and origin ACS 2023
- Neighborhood character
- Diverse neighborhood (Simpson 0.69)
- Race & ethnicity
- White 50% Asian 17% Black 13% Two or more races 13% Hispanic / Latino 11%
- Hispanic origin (detail)
- Mexican 6%
- Common ancestry
- Italian 3% Lithuanian 3% Scotch-Irish 2%
- Foreign-born
- 18% · China, Canada, Vietnam
- Languages at home
- 77% English-only · Spanish 7% Chinese 4% Other Asian/Pacific 3%
Political lean MEDSL · Alameda
- 2024 margin
- Solid D (+53.6) · D 74.6% · R 21.0% · Other 4.4%
- 2008→2024 swing
- -5.9pp toward R · 2008: 59.5pp · 2024: 53.6pp
- All cycles
- 2024: D+53.6 2020: D+62.5 2016: D+64.4 2012: D+59.8 2008: D+59.5
Not yet ingested
- Civics
- —
Market trends
- HPI YoY
- ▼ -1222.50%
- Current HPI
- 290.482
- Rent YoY
- ▲ 3.34%
- Metro
- San Francisco-Oakland-Berkeley, CA
- State GDP YoY
- ▲ 3.21%
- F500 in state
- 116
Industry mix (Fortune 500 HQ in CA)
| Industry | F500 HQs | Revenue |
|---|---|---|
| Technology | 27 | $1,492B |
|
||
| Financial Services | 3 | $174B |
|
||
| Retail | 3 | $44B |
|
||
| Insurance | 3 | $26B |
|
||
| Media / Entertainment | 2 | $115B |
|
||
| Pharmaceuticals / Biotech | 2 | $62B |
|
||
Price history
1 event — show timeline
- 2026-05-28 Listed $3,165,000 bridgeMLS, Bay East AOR, or Contra Costa AOR
Property tax history
+7.3%/yrLatest (2025): $57,218 · -5.3% YoY. Source: county tax records.
Cash-flow waterfall
monthlySold comps — $/sqft
last 12 mo · ≤1 miLoading sold comps…