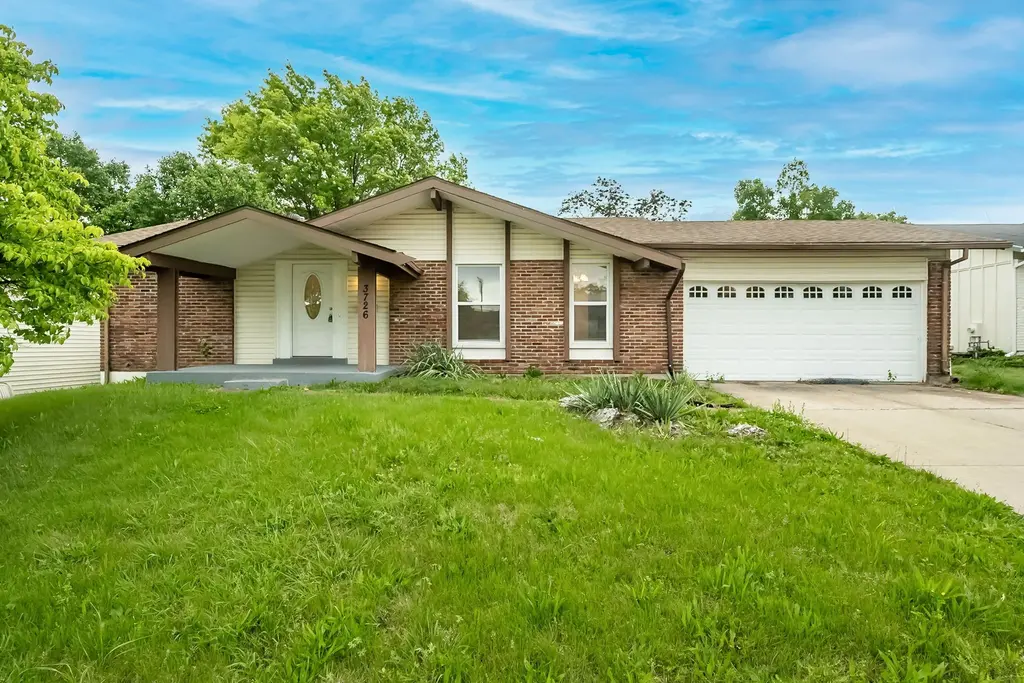
3726 Briargrove Dr
Old Jamestown, MO 63031
$208,000D-
3 bd · 2.0 ba ·
1,292 sqft ·
Built 1969
· SingleFamily
· Active
· 45 DOM
Cashflow @ list (25.0% down · 7.5%)
Estimated rent
$1,810/mo
Mortgage (P&I)
−$1,091
Tax + insurance
−$308
HOA
−$0
Vac / Maint / Mgmt
−$380
Net cashflow
$31/mo
Annual
$374/yr
Cap rate
6.47%
Cash-on-cash
0.64%
DSCR
1.03
1% rule
0.87%
Cash to close
$58,240
Investor read
- This is a 3-bed/2.0-bath single-family listed at $208k.
- At list price, monthly cash flow is $31 ($374/yr) — positive.
- The deal already cash-flows at list — no discount required.
- To meet the 1% rule (rent ≥ 1% of price), the offer needs to be $181k (13.0% below list).
- It's been on market 45 days — a 3% lower offer ($202k) is reasonable based on typical stale-listing flexibility.
- Recommended offer: $181k (13.0% below list) — sets the bar for 1% rule.
- Local home prices are declining (-3.0%/yr); year-one equity from $1k of loan paydown is wiped out by about $6k of value loss. Plan a longer hold.
- Location reads 66/100 on livability (#247 in MO) — a middle-class / working-renter tenant base. Strengths: employment A+, housing A+, cost of living A; Watch: amenities F, commute F, health & safety F.
- Hazelwood (suburban): math 11% / reading 26% proficiency, ranked #306 of 324 in MO (top 94%) — low school quality limits family demand, transient renter base, plan for 1-2y turnover.
- Zoned schools: Brown Elem. (math 8% / reading 22%, grade F, #982 of 1,115 statewide, top 89%, 335 students, 65% FRL); Hazelwood Central High (math 12% / reading 33%, grade F, #455 of 521 statewide, top 88%, 1,628 students, 52% FRL).
- Market conditions: Rents rising fast (+4.3%/yr); 272 active listings in the ZIP; 7 comparable units currently listed for rent nearby; rentals leasing fast (median 14d on market — plan ~1-2 weeks tenant-placement turnaround); 920 units permitted in St. Louis County in 2024 (250 in 5+ unit buildings).
- 4 sale attempts since 8y ago with the ask held roughly flat each time — persistent listings suggest the price (not the market) is what's stuck; bring a comps-based counter.
- Current owner paid $149k; 40% above their basis — modest negotiation headroom, anchor on the comps not their cost.
- Climate carrying-cost: extreme-heat days projected 7→21/yr by 2055 (HVAC capex compounding) — expect insurance premiums to compound above CPI over the hold.
- Cap rate 6.5% vs local median 5.3% in Old Jamestown — meaningfully above typical; check what's discounted (condition, days-on-market, listing class) to confirm the premium yield is real.
- This rent runs 31% of the median local income ($71k/yr) — at the standard rent-burdened threshold; future hikes will face affordability resistance.
Questions for listing agent
- It's been on market 45 days. Have you received any prior offers? Is the seller open to a 13% concession, seller financing, or rate buy-down credit?
- Built in 1969 — when were the roof, HVAC, electrical panel, plumbing, and water heater last replaced?
- Is there a deadline driving the sale (1031 exchange, divorce, estate, relocation)? That informs how much negotiation room exists.
- The area grade is low — what's the realistic commute time and amenity access for the typical tenant pool here? Any planned neighborhood developments (good or bad) we should know about?
- What's the average days-on-market for RENTAL listings here right now (not sales)? A rising rental-DOM trend means longer vacancies and softer asking-rent achievability than the comps imply.
- What's the recent tenant-quality profile in this submarket — average credit score on applications, eviction rate, late-payment / NSF rate, and stable-employment percentage? A property-management company in the area should have these aggregated.
- How much new for-sale + rental construction is in the pipeline within 1–3 miles? Heavy new supply typically softens prices + rents 12–24 months out; constrained supply supports both.
CashFlowRE · CFR-33HQZHA2C6S6KS
· Data 3 h ago
cashflowre.app · 2026-05-29