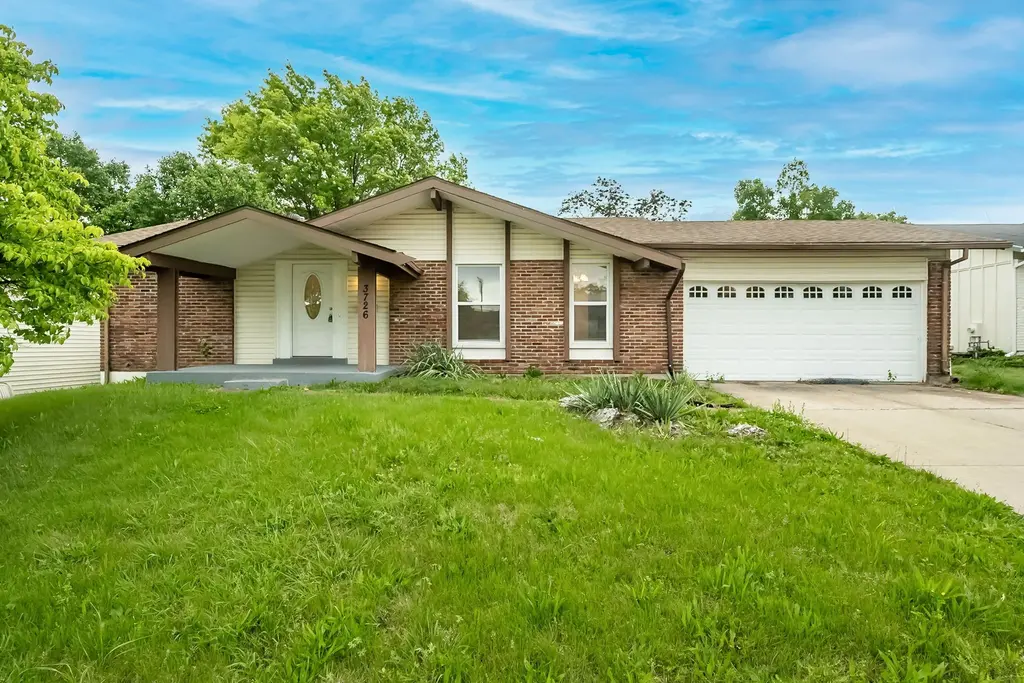
3726 Briargrove Dr · Old Jamestown, MO
Flood risk 1/10 · Minimal
- FEMA flood zone
- X (unshaded)
- Chance of flooding over 30 yrs
- 0.0%
- Est. flood insurance / yr
- $473 – $860
Fire risk 1/10 · Minimal
- Est. fire insurance / yr
- $1,054 – $1,958
Heat risk 5/10 · Moderate
- Hot days now (above 106°F)
- 7 days/yr
- Hot days in 30 yrs
- 21 days/yr
Wind risk 2/10 · Minimal
- Chance of severe wind over 30 yrs
- 1.0%
Air-quality risk 3/10 · Minor
- Unhealthy air days now
- 3 days/yr
- Unhealthy air days in 30 yrs
- 5 days/yr
Risk factors via First Street. Map © Google.
Why this score? — see what drove the D- grade
The composite is a weighted blend of 9 inputs, each scored 0–100. Each bar is that input's sub-score; the figure is the points it added to the 100-point composite (weight × sub-score).
- Cash flow +14.1/30.0
- ARV discount +6.7/15.0
- DSCR +4.3/10.0
- 1% rule +3.7/10.0
- Rent growth +3.6/5.0
- Livability +3.3/5.0
- Condition / age +2.5/5.0
- Schools +1.7/10.0
- Appreciation +0.0/10.0
$208,000
🖨 Deal sheet (PDF) 📄 Offer letter ✓ Due diligence
Listing remarks MLS
Gorgeous refinished wood floors will greet you as you entere into this newly renovated 3 bed, 2 bath home. Located in a beautiful neighborhood, with a fenced in back yard, you’ll feel right at home. There’s plenty of room for the whole family with an open kitchen, and large family room all on the main floor. The Master Bedroom has it’s own full bath (shower/no tub) outlined with beautiful ceramic tile. Six panel doors throughout the upstairs along with beautiful French doors that exit right out to the back yard patio. And there’s plenty of storage area in the unfinished basement. It’s all waiting just for you.
Key facts
- 8,581 sq ft lot
- 2 garage spots
- Built 1969
Property features AI
Finance
- Financial info: Lease not considered; Seller may consider concessions
Exterior
- Parking: Attached 2-car garage
- Utilities: Public water; Public sewer; Electric service by Ameren; Electricity connected; Natural gas connected; Sewer connected
- Home design: Single-family residence; One story; House structure
- Construction: Brick construction; Architectural shingle roof; Concrete perimeter foundation; Built (year per public records)
- Exterior features: Private yard; Patio; Back and front yard; Level lot; Chain-link fenced backyard
Interior
- Kitchen: Dishwasher; Disposal; Electric oven; Electric range; Refrigerator
- Bedrooms: Three main-level bedrooms
- Flooring: Hardwood floors
- Bathrooms: Two full bathrooms (main level)
- Heating & cooling: Forced air heating; Central air conditioning; Ceiling fans for cooling
- Interior features: Ceiling fans throughout; Kitchen/dining room combo; Living room fireplace
- Laundry & utility: Laundry in basement; Gas water heater
Neighborhood map
What this means for you Summary
Snapshot
- This is a 3-bed/2.0-bath single-family listed at $208k.
Deal economics
- At list price, monthly cash flow is $31 ($374/yr) — positive.
- The deal already cash-flows at list — no discount required.
- To meet the 1% rule (rent ≥ 1% of price), the offer needs to be $181k (13.0% below list).
- Recommended offer: $181k (13.0% below list) — sets the bar for 1% rule.
- Cap rate 6.5% vs local median 5.3% in Old Jamestown — meaningfully above typical; check what's discounted (condition, days-on-market, listing class) to confirm the premium yield is real.
Location & tenants
- Location reads 66/100 on livability (#247 in MO) — a middle-class / working-renter tenant base. Strengths: employment A+, housing A+, cost of living A; Watch: amenities F, commute F, health & safety F.
- Hazelwood (suburban): math 11% / reading 26% proficiency, ranked #306 of 324 in MO (top 94%) — low school quality limits family demand, transient renter base, plan for 1-2y turnover.
- Zoned schools: Brown Elem. (math 8% / reading 22%, grade F, #982 of 1,115 statewide, top 89%, 335 students, 65% FRL); Hazelwood Central High (math 12% / reading 33%, grade F, #455 of 521 statewide, top 88%, 1,628 students, 52% FRL).
- Market conditions: Rents rising fast (+4.3%/yr); 271 active listings in the ZIP; 7 comparable units currently listed for rent nearby; rentals leasing fast (median 13d on market — plan ~1-2 weeks tenant-placement turnaround); 920 units permitted in St. Louis County in 2024 (250 in 5+ unit buildings).
- This rent runs 31% of the median local income ($71k/yr) — at the standard rent-burdened threshold; future hikes will face affordability resistance.
Forward outlook
- Local home prices are declining (-3.0%/yr); year-one equity from $1k of loan paydown is wiped out by about $6k of value loss. Plan a longer hold.
Negotiation context
- It's been on market 42 days — a 3% lower offer ($202k) is reasonable based on typical stale-listing flexibility.
- 4 sale attempts since 8y ago with the ask held roughly flat each time — persistent listings suggest the price (not the market) is what's stuck; bring a comps-based counter.
- Current owner paid $149k; 40% above their basis — modest negotiation headroom, anchor on the comps not their cost.
Risks & watch-outs
- Climate carrying-cost: extreme-heat days projected 7→21/yr by 2055 (HVAC capex compounding) — expect insurance premiums to compound above CPI over the hold.
Questions for the listing agent
- It's been on market 42 days. Have you received any prior offers? Is the seller open to a 13% concession, seller financing, or rate buy-down credit?
- Built in 1969 — when were the roof, HVAC, electrical panel, plumbing, and water heater last replaced?
- Is there a deadline driving the sale (1031 exchange, divorce, estate, relocation)? That informs how much negotiation room exists.
- The area grade is low — what's the realistic commute time and amenity access for the typical tenant pool here? Any planned neighborhood developments (good or bad) we should know about?
- What's the average days-on-market for RENTAL listings here right now (not sales)? A rising rental-DOM trend means longer vacancies and softer asking-rent achievability than the comps imply.
- What's the recent tenant-quality profile in this submarket — average credit score on applications, eviction rate, late-payment / NSF rate, and stable-employment percentage? A property-management company in the area should have these aggregated.
- How much new for-sale + rental construction is in the pipeline within 1–3 miles? Heavy new supply typically softens prices + rents 12–24 months out; constrained supply supports both.
Investment metrics
- 1% rule
- 0.87% ✗
- Cap rate
- 6.47%
- Cash-on-cash
- 0.64%
- DSCR
- 1.03
- GRM
- 9.6
CMA / ARV
- ARV (median comp)
- $204,149
- List price
- $208,000
- Delta
- 1.89%
- Verdict
- FAIR
- Comps
- 20 within 1.0 mi
Show comp detail 12 sales within ~0.75 mi
| Address | Dist | Beds/Ba | Sqft | Sold | Price | $/sf | Match |
|---|---|---|---|---|---|---|---|
| 3823 Salvation Rd | 0.24mi | 3/2.0 | 1,416 (+10%) | 1mo | $275,000 | $194 | 72 |
| 3844 Rapids Dr | 0.62mi | 3/2.0 | 1,279 (-1%) | 6mo | $299,900 | $234 | 64 |
| 3865 Kentucky Derby Dr | 0.40mi | 3/2.0 | 1,430 (+11%) | 6mo | $199,900 | $140 | 59 |
| 3660 Woodman Dr | 0.27mi | 3/1.5 | 1,102 (-15%) | 5mo | $179,900 | $163 | 57 |
| 3870 Hope Haven Dr | 0.55mi | 3/2.0 | 1,186 (-8%) | 7mo | $249,900 | $211 | 55 |
| 16005 Rose Wreath Ln | 0.74mi | 2/2.0 (-1) | 1,248 (-3%) | 0mo | $175,000 | $140 | 54 |
| 850 Liberty Village Dr | 0.73mi | 3/2.0 | 1,226 (-5%) | 4mo | $177,000 | $144 | 54 |
| 1641 Sherwood Forest Dr | 0.61mi | 3/2.0 | 1,184 (-8%) | 6mo | $195,000 | $165 | 53 |
| 3833 Hope Haven Dr | 0.51mi | 3/2.5 | 1,457 (+13%) | 3mo | $279,000 | $191 | 50 |
| 1703 Boardwalk Ave | 0.74mi | 3/2.0 | 1,416 (+10%) | 3mo | $195,000 | $138 | 47 |
| 1618 Ventnor Pl | 0.66mi | 3/3.0 | 1,159 (-10%) | 1mo | $214,900 | $185 | 47 |
| 3213 Yvette Ct | 0.59mi | 3/— | 1,128 (-13%) | 6mo | $214,900 | $191 | 47 |
Match score weights: distance 35% · size 25% · config 20% · recency 20%. Top-matched comps best support the ARV.
Projected returns pro-forma
-3.0% appreciation · 4.27% rent growth · sell at horizon
- IRR
- -13.9%
- Equity multiple
- 0.50×
- Total profit
- $-29,374
- Equity at exit
- $31,013
- IRR
- -3.2%
- Equity multiple
- 0.77×
- Total profit
- $-13,142
- Equity at exit
- $17,984
Cash invested: $58,240 (down + closing). Projections, not guarantees.
Landlord ↔ Tenant lean methodology
- Overall (STATE)
- 81 Strongly Landlord-Friendly
- State Missouri
- 81 Strongly Landlord-Friendly · R+10
- County
- — inherits STATE
- City
- — inherits STATE
ZIP-level market 63031
- Rents YoY
- 4.3%
- Active inventory
- 271
- Price-to-rent
- 9.6×
Monthly cashflow live
- Estimated rent
- $1,810 high interval (Pro) →
- Mortgage (P&I)
- −$1,091
- Tax from tax record
- −$222 /mo · $2,659/yr
- Insurance
- −$87
- HOA
- −$0
- Vacancy / Maint / Mgmt
- −$380
- Net cashflow
- $31
Break-even live
Sensitivity live
| Price | -10% $149 | -5% $90 | +0% $31 | +5% $-28 | +10% $-87 |
|---|---|---|---|---|---|
| Rent | -10% $-112 | -5% $-40 | +0% $31 | +5% $103 | +10% $174 |
| Rate | -1.0pp $136 | -0.5pp $84 | base $31 | +0.5pp $-23 | +1.0pp $-78 |
UW: 25.0% down · 7.5% · 30yr · 1.5% tax · 5.0% vac · 8.0% maint · 8.0% mgmt
Financing live
Cash to close
- Down payment
- $52,000
- Closing costs
- $6,240
- Reserves months
- —
- Total cash needed
- —
Loan-product check · same deal, 3 products live
Conventional
25% down · 7.5% · 30yr
- Down + closing
- —
- Monthly P&I
- —
- Monthly cashflow
- —
- DSCR
- —
- Eligible?
- —
Personal DTI + credit; lowest rate.
DSCR
20% down · 8.5% · 30yr
- Down + closing
- —
- Monthly P&I
- —
- Monthly cashflow
- —
- DSCR
- —
- Eligible?
- —
No personal income docs; deal must DSCR.
Hard money
10% down · 12.0% · 12mo
- Down + closing
- —
- Monthly P&I
- —
- Monthly cashflow
- —
- DSCR
- —
- Eligible?
- —
Short-term bridge; refi at stabilization.
Rent comps 7 comps
| Address | Beds | Baths | Sqft | Rent | $/sqft | DOM | Units | Dist |
|---|---|---|---|---|---|---|---|---|
| 3710 Woodman Dr Florissant, MO | 4.0 | 1.5 | 1802 | $2,091 | $1.16 | 2d | 1 | 0.27mi |
| 1332 Langholm Dr Florissant, MO | 3.0 | 1.0 | 924 | $1,650 | $1.79 | 2d | 1 | 0.29mi |
| 3015 Matlock Dr Florissant, MO | 3.0 | 1.0 | 950 | $1,475 | $1.55 | 44d | 1 | 0.74mi |
| 2857 Dawnview Dr Florissant, MO | 3.0 | 1.0 | 890 | $1,325 | $1.49 | 8d | 1 | 0.99mi |
| 2942 Chance Dr Florissant, MO | 3.0 | 1.0 | 912 | $1,700 | $1.86 | 13d | 1 | 1.00mi |
| 15686 93rd Ave Florissant, MO | 3.0 | 2.0 | 1370 | $1,948 | $1.42 | 13d | 1 | 1.17mi |
| 775 Sherwood Dr Florissant, MO | 3.0 | 1.0 | 1023 | $1,690 | $1.65 | 44d | 1 | 1.29mi |
Listing history 28 events
-
2026-06-18days on market $208,000 Active 42 DOM
-
2026-06-17days on market $208,000 Active 41 DOM
-
2026-06-16days on market $208,000 Active 40 DOM
-
2026-06-15days on market $208,000 Active 39 DOM
-
2026-06-13days on market $208,000 Active 37 DOM
-
2026-06-13days on market $208,000 Active 36 DOM
-
2026-06-09days on market $208,000 Active 33 DOM
-
2026-06-08days on market $208,000 Active 32 DOM
-
2026-06-07days on market $208,000 Active 31 DOM
-
2026-06-05days on market $208,000 Active 28 DOM
-
2026-06-03days on market $208,000 Active 27 DOM
-
2026-06-02days on market $208,000 Active 26 DOM
-
2026-06-02price $208,000 Active 25 DOM
-
2026-06-01days on market $215,000 Active 25 DOM
-
2026-05-31days on market $215,000 Active 24 DOM
-
2026-05-08$215,000 Active 948-char remark
-
2026-05-04historical $215,000 948-char remark
-
2023-09-15historical
-
2023-07-25status Active
-
2023-07-25price $195,000
-
2023-06-15historical
-
2023-05-10$210,000 Active
-
2019-03-15soldstatus $149,000
-
2018-09-12soldstatus Closed
Show marketing remark (647 chars)
Gorgeous refinished wood floors will greet you as you entere into this newly renovated 3 bed, 2 bath home. Located in a beautiful neighborhood, with a fenced in back yard, you’ll feel right at home. There’s plenty of room for the whole family with an open kitchen, and large family room all on the main floor. The Master Bedroom has it’s own full bath (shower/no tub) outlined with beautiful ceramic tile. Six panel doors throughout the upstairs along with beautiful French doors that exit right out to the back yard patio. And there’s plenty of storage area in the unfinished basement. It’s all waiting just for you.
-
2018-08-29status Pending
Show marketing remark (647 chars)
Gorgeous refinished wood floors will greet you as you entere into this newly renovated 3 bed, 2 bath home. Located in a beautiful neighborhood, with a fenced in back yard, you’ll feel right at home. There’s plenty of room for the whole family with an open kitchen, and large family room all on the main floor. The Master Bedroom has it’s own full bath (shower/no tub) outlined with beautiful ceramic tile. Six panel doors throughout the upstairs along with beautiful French doors that exit right out to the back yard patio. And there’s plenty of storage area in the unfinished basement. It’s all waiting just for you.
-
2018-08-29$112,000 Active
Show marketing remark (647 chars)
Gorgeous refinished wood floors will greet you as you entere into this newly renovated 3 bed, 2 bath home. Located in a beautiful neighborhood, with a fenced in back yard, you’ll feel right at home. There’s plenty of room for the whole family with an open kitchen, and large family room all on the main floor. The Master Bedroom has it’s own full bath (shower/no tub) outlined with beautiful ceramic tile. Six panel doors throughout the upstairs along with beautiful French doors that exit right out to the back yard patio. And there’s plenty of storage area in the unfinished basement. It’s all waiting just for you.
-
2015-10-14soldstatus
-
2014-10-15soldstatus $45,000
ⓘ Source: listings_history table (triggers on properties + properties_extension) + one-shot
backfill from property_details.listing_events for pre-trigger history.
Tax reassessment forecast MO · Resets to sale price
- Current annual tax
- $2,659 · $222/mo
- Projected year-2 tax
- $2,659 · $222/mo
- Expected delta
- $0/yr ($0/mo · 0.0%)
ⓘ Screening estimate from a state-policy table — verify with the county assessor before closing.
Climate risk First Street
- Flood 1/10 Low FEMA zone X (unshaded) · 0% chance over 30 yrs
- Wildfire 1/10 Low
- Heat 5/10 Major 7 d/yr ≥106°F today · 21 d/yr by 30 yrs out
- Wind 2/10 Low 100% chance of damaging wind over 30 yrs
- Air quality 3/10 Moderate 3 unhealthy d/yr today · 5 by 30 yrs out
Nearby sold comps map
Loading sold comps map…
Walkable amenities ~0.75 mi
Loading nearby amenities…
Taxation est. · year 1
- Rental income
- $21,725
- − Mortgage interest
- −$11,651
- − Property taxes
- −$2,659
- − Insurance
- −$1,040
- − Repairs & maintenance
- −$1,738
- − Management
- −$1,738
- − Depreciation
- −$6,051
- Taxable loss
- −$3,153
- Est. tax savings @ 24.0%
- +$757
- After-tax cash flow
- $1,131/yr
For passive investors: Depreciation is non-cash, so a rental often shows a tax loss while cash-flowing — sheltering income. Rental losses are passive: they offset passive income freely, and up to $25,000/yr can offset ordinary (W-2) income if you actively participate and your MAGI is under $100k (phasing out to $0 by $150k); unused losses carry forward. On sale, claimed depreciation is recaptured at up to 25%, and gains may owe capital-gains tax (a 1031 exchange can defer both). Figures are a year-1 estimate at your 24.0% rate — not tax advice; consult a CPA.
Schools (NCES district)
- District
- Hazelwood
- NCES district ID
- 2913830
- Math proficiency
- 11% ▼ -13.00%
- Reading proficiency
- 26% ▼ -6.00%
- Median HH income
- $51,621
- Composite
- 16.77/100
- National rank
- #9156
- State rank
- #306 of 324 in MO
Livability — Old Jamestown
- Score
- 66/100
- State rank
- #247
- US rank
- #12156
Category grades
Schools grade is shown separately in the Schools card above.
Census & demographics
- County
- Saint Louis County · 888,823 people
- City population
- 19,557
- Metro
- St. Louis, MO-IL
- Population (ZIP)
- 50,196
- Household income
- $70,811
- Rent vs Own
- Severe rent burden
- 1279.0
Population outlook (St. Louis County) Hauer SSP2
- Today (2025)
- 1,025,227 people
- By 2030
- 1,028,023 · +0.3%
- By 2040
- 1,020,940 · -0.4%
- By 2050
- 1,007,280 · -1.8%
- By 2075
- 987,277 · -3.7%
- By 2100
- 921,984 · -10.1%
Race, ethnicity, and origin ACS 2023
- Neighborhood character
- Diverse neighborhood (Simpson 0.58)
- Race & ethnicity
- White 49% Black 41% Two or more races 7% Hispanic / Latino 2%
- Common ancestry
- Romanian 3% Lithuanian 3% Swedish 1%
- Foreign-born
- 5% · Canada, Jamaica
- Languages at home
- 94% English-only · Spanish 2% Arabic 1%
Political lean MEDSL · St. Louis
- 2024 margin
- Strong D (+23.4) · D 60.8% · R 37.4% · Other 1.7%
- 2008→2024 swing
- +3.5pp toward D · 2008: 19.9pp · 2024: 23.4pp
- All cycles
- 2024: D+23.4 2020: D+24.0 2016: D+16.2 2012: D+13.7 2008: D+19.9
Not yet ingested
- Civics
- —
Market trends
- HPI YoY
- ▼ -223.57%
- Current HPI
- 202.7192
- Rent YoY
- ▲ 4.27%
- Metro
- St. Louis, MO-IL
- State GDP YoY
- ▲ 1.84%
- F500 in state
- 20
Industry mix (Fortune 500 HQ in MO)
| Industry | F500 HQs | Revenue |
|---|---|---|
| Healthcare | 1 | $163B |
|
||
| Insurance | 1 | $21B |
|
||
| Industrial Technology | 1 | $17B |
|
||
| Retail | 1 | $16B |
|
||
| Industrial Distribution | 1 | $10B |
|
||
| Utilities | 1 | $9B |
|
||
Price history
+362.2% since first listed14 events — show timeline
- 2026-06-01 Price Changed $208,000 MARIS as Distributed by MLS Grid
- 2026-05-08 Listed $215,000 MARIS as Distributed by MLS Grid
- 2026-05-04 Coming Soon $215,000 MARIS as Distributed by MLS Grid
- 2023-09-15 Delisted — MARIS as Distributed by MLS Grid
- 2023-07-25 Relisted — MARIS as Distributed by MLS Grid
- 2023-07-25 Price Changed $195,000 MARIS as Distributed by MLS Grid
- 2023-06-15 Delisted — MARIS as Distributed by MLS Grid
- 2023-05-10 Listed $210,000 MARIS as Distributed by MLS Grid
- 2019-03-15 Sold (Public Records) $149,000 Public Records
- 2018-09-12 Sold (MLS) — MARIS as Distributed by MLS Grid
- 2018-08-29 Pending — MARIS as Distributed by MLS Grid
- 2018-08-29 Listed $112,000 MARIS as Distributed by MLS Grid
- 2015-10-14 Sold (Public Records) — Public Records
- 2014-10-15 Sold (Public Records) $45,000 Public Records
Property tax history
+4.8%/yrLatest (2022): $2,659 · +1.5% YoY. Source: county tax records.
Cash-flow waterfall
monthlySold comps — $/sqft
last 12 mo · ≤1 miLoading sold comps…