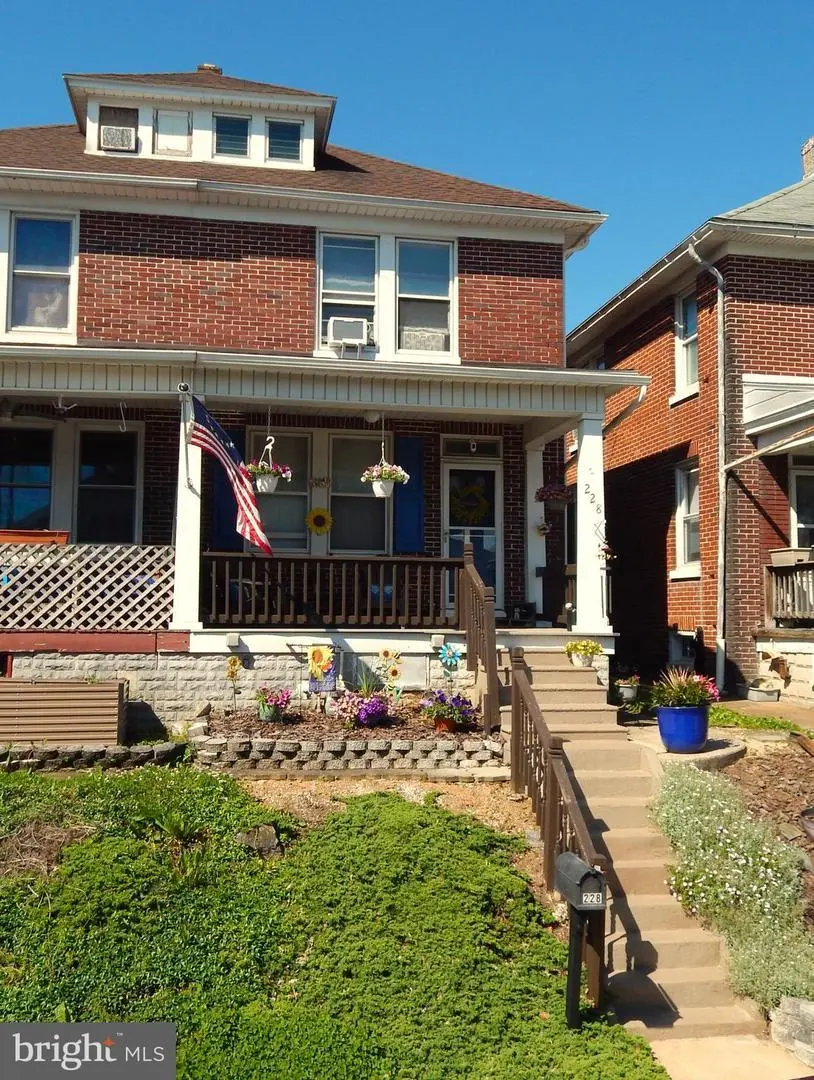
228 Wise Ave
Red Lion, PA 17356
$220,000F
3 bd · 1.0 ba ·
1,408 sqft ·
Built 1924
· Townhouse
· Pending
· 5 DOM
Cashflow @ list (25.0% down · 7.5%)
Estimated rent
$1,526/mo
Mortgage (P&I)
−$1,154
Tax + insurance
−$316
HOA
−$0
Vac / Maint / Mgmt
−$320
Net cashflow
$-265/mo
Annual
$-3,175/yr
Cap rate
4.85%
Cash-on-cash
-5.15%
DSCR
0.77
1% rule
0.69%
Cash to close
$61,600
Investor read
- This is a 3-bed/1.0-bath townhouse listed at $220k.
- At list price, monthly cash flow is $-265 ($-3k/yr) — negative.
- To cash-flow at today's rent, offer at most $173k (21.2% below list).
- To meet the 1% rule (rent ≥ 1% of price), the offer needs to be $153k (30.7% below list).
- Only 5 days on market — expect competitive offers; lowballing is unlikely to land.
- Recommended offer: $153k (30.7% below list) — sets the bar for 1% rule.
- Local home prices are declining (-3.0%/yr); year-one equity from $2k of loan paydown is wiped out by about $7k of value loss. Plan a longer hold.
- Location reads 77/100 on livability (#349 in PA, #3,056 nationally) — a middle-class / working-renter tenant base. Strengths: cost of living A+, housing A+, health & safety A+; Watch: amenities D, commute F.
- Red Lion Area SD (suburban): math 36% / reading 50% proficiency, ranked #282 of 539 in PA (top 52%) — families likely to look elsewhere, expect single-tenant / working-renter base with shorter leases.
- Zoned schools: Pleasant View El Sch (math 33% / reading 53%, grade F, #873 of 1,518 statewide, top 58%, 453 students, 49% FRL); Red Lion Area Jhs (math 23% / reading 49%, grade F, #313 of 512 statewide, top 62%, 813 students, 50% FRL); Red Lion Area Shs (math 63% / reading 24%, grade F, #211 of 437 statewide, top 48%, 1,432 students, 44% FRL) — zoned schools average 47% FRL vs 28% district-wide (19 pts higher); higher-poverty schools than district average — tighter screening recommended.
- Watch-outs: built in 1924 — expect roof / HVAC / electrical / plumbing capex.
- Market conditions: 147 active listings in the ZIP; 7 comparable units currently listed for rent nearby; rentals lingering (median 46d on market — plan ~5-8 weeks vacancy on turnover, expect pricing pressure); 57% of comp listings sitting > 30 days — soft ceiling on asking rent; solid renter incomes; 1,328 units permitted in York County in 2024 (338 in 5+ unit buildings).
- 3 sale attempts since 28y ago with the ask held roughly flat each time — persistent listings suggest the price (not the market) is what's stuck; bring a comps-based counter.
- Current owner paid $110k; list at $220k implies a 99% gain — meaningful room to come down on a strong offer.
- Climate carrying-cost: extreme-heat days projected 7→15/yr by 2055 (HVAC capex compounding) — expect insurance premiums to compound above CPI over the hold.
Questions for listing agent
- What do current leases actually rent for vs. the listed asking? Can we see a recent rent roll and the last 12 months of T-12 income?
- Built in 1924 — when were the roof, HVAC, electrical panel, plumbing, and water heater last replaced?
- Is there a deadline driving the sale (1031 exchange, divorce, estate, relocation)? That informs how much negotiation room exists.
- The area grade is low — what's the realistic commute time and amenity access for the typical tenant pool here? Any planned neighborhood developments (good or bad) we should know about?
- What's the average days-on-market for RENTAL listings here right now (not sales)? A rising rental-DOM trend means longer vacancies and softer asking-rent achievability than the comps imply.
- What's the recent tenant-quality profile in this submarket — average credit score on applications, eviction rate, late-payment / NSF rate, and stable-employment percentage? A property-management company in the area should have these aggregated.
- How much new for-sale + rental construction is in the pipeline within 1–3 miles? Heavy new supply typically softens prices + rents 12–24 months out; constrained supply supports both.
CashFlowRE · CFR-35Q8A06G2KGVA6
· Data 1 week ago
cashflowre.app · 2026-05-29