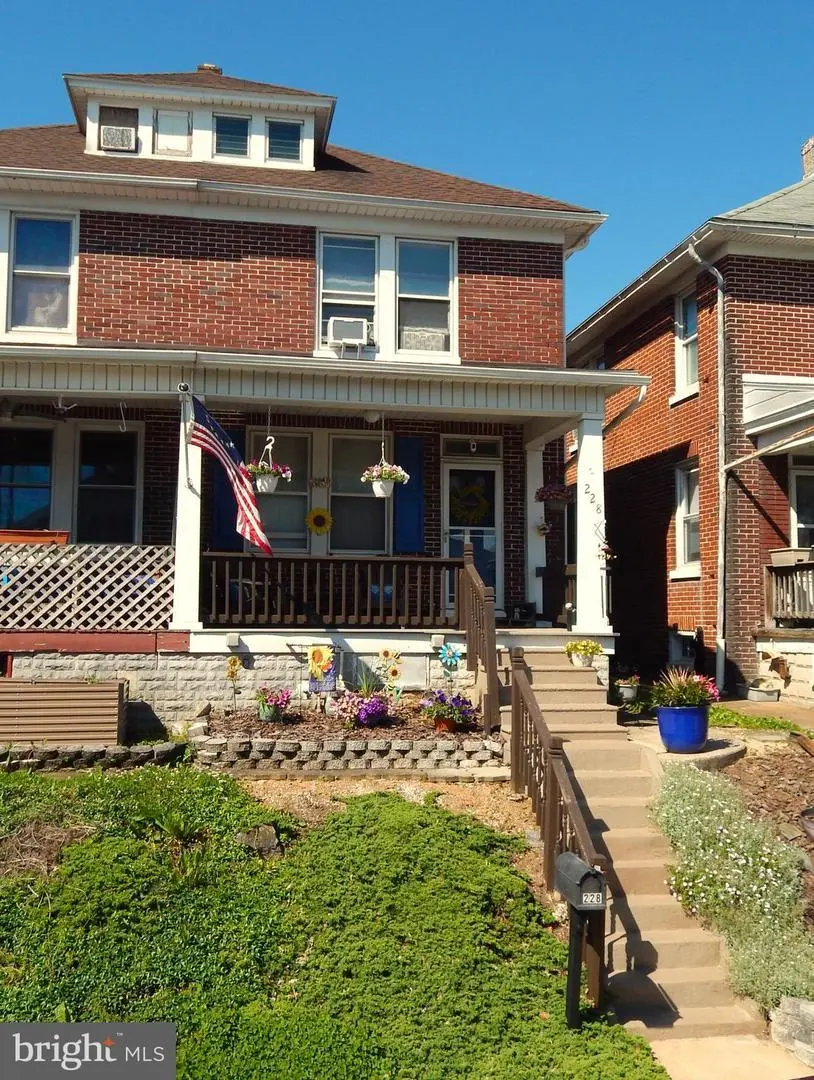
228 Wise Ave · Red Lion, PA
Flood risk 1/10 · Minimal
- FEMA flood zone
- X (unshaded)
- Chance of flooding over 30 yrs
- 0.0%
- Est. flood insurance / yr
- $473 – $860
Fire risk 1/10 · Minimal
- Est. fire insurance / yr
- $511 – $949
Heat risk 5/10 · Moderate
- Hot days now (above 100°F)
- 7 days/yr
- Hot days in 30 yrs
- 15 days/yr
Wind risk 4/10 · Minor
- Chance of severe wind over 30 yrs
- 12.0%
Air-quality risk 3/10 · Minor
- Unhealthy air days now
- 2 days/yr
- Unhealthy air days in 30 yrs
- 5 days/yr
Risk factors via First Street. Map © Google.
Why this score? — see what drove the F grade
The composite is a weighted blend of 9 inputs, each scored 0–100. Each bar is that input's sub-score; the figure is the points it added to the 100-point composite (weight × sub-score).
- Cash flow +7.6/30.0
- Livability +3.9/5.0
- Schools +3.8/10.0
- Rent growth +2.5/5.0
- Condition / age +2.5/5.0
- 1% rule +1.9/10.0
- DSCR +1.7/10.0
- ARV discount +1.2/15.0
- Appreciation +0.0/10.0
$220,000
🖨 Deal sheet (PDF) 📄 Offer letter ✓ Due diligence
Listing remarks MLS
All brick 3 bdrm, 1 1/2 bath home with so many upgrades near schools & a park. Outside has a new 6 ft. stockade fence around a nice yard w/ a 1-car detached garage w/ basement in the back. Inside you get an great home w/ beautiful wood floors. natural woodwork, heated basement, lg eat-in kitchen, laundry rm, walkup attic and lots more!
Key facts
- Finished attic
- Natural gas boiler
- Updated bathrooms
Tags
Property features AI
Finance
- Other: Fee simple ownership
Exterior
- Parking: On-street parking; Garage structure present
- Utilities: Public water; Public sewer; 100 amp electric service; Natural gas for heating and hot water
- Home design: Semi-detached residence; Above-grade and below-grade living areas; Finished above-grade area estimated at 1,536; Below-grade unfinished area estimated at 704
- Construction: Brick construction; Stone foundation; Asphalt shingle roof
- Exterior features: Porches, balcony, and decks; Not in a federal flood zone; Public road frontage (approximately 20 feet)
Interior
- Kitchen: Dishwasher
- Bedrooms: Three bedrooms on the first upper level; One bedroom on the second upper level; Rooms include: Living Room, Kitchen, Bedroom 1, Bedroom 2, Bedroom 3, Bedroom 4, Laundry, Utility Room
- Flooring: Laminate flooring
- Bathrooms: One full bathroom on the first upper level; One half bathroom on the main level; Total: 1 full bath, 1 half bath
- Heating & cooling: Baseboard hot water heating; Heat pump with electric backup; Cooling via window units and ductless/mini-split (electric)
- Interior features: Storm door; Full basement
- Laundry & utility: Laundry on the main floor; Utility room
Neighborhood map
What this means for you Summary
Snapshot
- This is a 3-bed/1.0-bath townhouse listed at $220k.
Deal economics
- At list price, monthly cash flow is $-265 ($-3k/yr) — negative.
- To cash-flow at today's rent, offer at most $173k (21.2% below list).
- To meet the 1% rule (rent ≥ 1% of price), the offer needs to be $153k (30.7% below list).
- Recommended offer: $153k (30.7% below list) — sets the bar for 1% rule.
Location & tenants
- Location reads 77/100 on livability (#349 in PA, #3,056 nationally) — a middle-class / working-renter tenant base. Strengths: cost of living A+, housing A+, health & safety A+; Watch: amenities D, commute F.
- Red Lion Area SD (suburban): math 36% / reading 50% proficiency, ranked #282 of 539 in PA (top 52%) — families likely to look elsewhere, expect single-tenant / working-renter base with shorter leases.
- Zoned schools: Pleasant View El Sch (math 33% / reading 53%, grade F, #873 of 1,518 statewide, top 58%, 453 students, 49% FRL); Red Lion Area Jhs (math 23% / reading 49%, grade F, #313 of 512 statewide, top 62%, 813 students, 50% FRL); Red Lion Area Shs (math 63% / reading 24%, grade F, #211 of 437 statewide, top 48%, 1,432 students, 44% FRL) — zoned schools average 47% FRL vs 28% district-wide (19 pts higher); higher-poverty schools than district average — tighter screening recommended.
- Market conditions: 147 active listings in the ZIP; 7 comparable units currently listed for rent nearby; rentals lingering (median 46d on market — plan ~5-8 weeks vacancy on turnover, expect pricing pressure); 57% of comp listings sitting > 30 days — soft ceiling on asking rent; solid renter incomes; 1,328 units permitted in York County in 2024 (338 in 5+ unit buildings).
Forward outlook
- Local home prices are declining (-3.0%/yr); year-one equity from $2k of loan paydown is wiped out by about $7k of value loss. Plan a longer hold.
Negotiation context
- Only 5 days on market — expect competitive offers; lowballing is unlikely to land.
- 3 sale attempts since 28y ago with the ask held roughly flat each time — persistent listings suggest the price (not the market) is what's stuck; bring a comps-based counter.
- Current owner paid $110k; list at $220k implies a 99% gain — meaningful room to come down on a strong offer.
Risks & watch-outs
- Watch-outs: built in 1924 — expect roof / HVAC / electrical / plumbing capex.
- Climate carrying-cost: extreme-heat days projected 7→15/yr by 2055 (HVAC capex compounding) — expect insurance premiums to compound above CPI over the hold.
Questions for the listing agent
- What do current leases actually rent for vs. the listed asking? Can we see a recent rent roll and the last 12 months of T-12 income?
- Built in 1924 — when were the roof, HVAC, electrical panel, plumbing, and water heater last replaced?
- Is there a deadline driving the sale (1031 exchange, divorce, estate, relocation)? That informs how much negotiation room exists.
- The area grade is low — what's the realistic commute time and amenity access for the typical tenant pool here? Any planned neighborhood developments (good or bad) we should know about?
- What's the average days-on-market for RENTAL listings here right now (not sales)? A rising rental-DOM trend means longer vacancies and softer asking-rent achievability than the comps imply.
- What's the recent tenant-quality profile in this submarket — average credit score on applications, eviction rate, late-payment / NSF rate, and stable-employment percentage? A property-management company in the area should have these aggregated.
- How much new for-sale + rental construction is in the pipeline within 1–3 miles? Heavy new supply typically softens prices + rents 12–24 months out; constrained supply supports both.
Investment metrics
- 1% rule
- 0.69% ✗
- Cap rate
- 4.85%
- Cash-on-cash
- -5.15%
- DSCR
- 0.77
- GRM
- 12.0
CMA / ARV
- ARV (on-the-fly)
- $192,896
- Comps found
- 12
Show comp detail 12 sales within ~0.75 mi
| Address | Dist | Beds/Ba | Sqft | Sold | Price | $/sf | Match |
|---|---|---|---|---|---|---|---|
| 11 E Lancaster St | 0.06mi | 4/1.5 (+1) | 1,523 (+8%) | 4mo | $192,500 | $126 | 74 |
| 316 W Broadway | 0.44mi | 3/1.0 | 1,478 (+5%) | 3mo | $202,500 | $137 | 69 |
| 28 Pleasant Ave | 0.55mi | 3/1.0 | 1,386 (-2%) | 5mo | $160,000 | $115 | 67 |
| 118 Keener Ave | 0.52mi | 3/— | 1,286 (-9%) | 1mo | $176,750 | $137 | 60 |
| 171 Linden Ave | 0.66mi | 3/1.0 | 1,344 (-4%) | 2mo | $174,000 | $129 | 60 |
| 79 E 1st Ave | 0.41mi | 4/1.5 (+1) | 1,484 (+5%) | 6mo | $168,500 | $114 | 60 |
| 81 W 1st Ave Unit E | 0.41mi | 4/2.0 (+1) | 1,484 (+5%) | 6mo | $168,500 | $114 | 58 |
| 327 1st Ave | 0.57mi | 4/2.0 (+1) | 1,471 (+4%) | 1mo | $205,000 | $139 | 56 |
| 217 N Charles St | 0.53mi | 3/2.0 | 1,500 (+6%) | 5mo | $222,500 | $148 | 56 |
| 130 Linden Ave | 0.64mi | 3/1.0 | 1,496 (+6%) | 9mo | $16,756 | $11 | 52 |
| 270 N Main St | 0.68mi | 4/1.0 (+1) | 1,340 (-5%) | 6mo | $185,000 | $138 | 51 |
| 254 W High St | 0.71mi | 3/2.0 | 1,313 (-7%) | 8mo | $205,000 | $156 | 45 |
Match score weights: distance 35% · size 25% · config 20% · recency 20%. Top-matched comps best support the ARV.
Projected returns pro-forma
-3.0% appreciation · 3.0% rent growth · sell at horizon
- IRR
- -25.1%
- Equity multiple
- 0.15×
- Total profit
- $-52,507
- Equity at exit
- $32,803
- IRR
- -21.1%
- Equity multiple
- -0.09×
- Total profit
- $-67,451
- Equity at exit
- $19,022
Cash invested: $61,600 (down + closing). Projections, not guarantees.
Landlord ↔ Tenant lean methodology
- Overall (STATE)
- 62 Landlord-Friendly
- State Pennsylvania
- 62 Landlord-Friendly · EVEN
- County
- — inherits STATE
- City
- — inherits STATE
ZIP-level market 17356
- Home prices YoY
- -21.0%
- Active inventory
- 147
- Price-to-rent
- 12.0×
Monthly cashflow live
- Estimated rent
- $1,526 high interval (Pro) →
- Mortgage (P&I)
- −$1,154
- Tax from tax record
- −$224 /mo · $2,693/yr
- Insurance
- −$92
- HOA
- −$0
- Vacancy / Maint / Mgmt
- −$320
- Net cashflow
- $-265
Break-even live
Sensitivity live
| Price | -10% $-140 | -5% $-202 | +0% $-265 | +5% $-327 | +10% $-389 |
|---|---|---|---|---|---|
| Rent | -10% $-385 | -5% $-325 | +0% $-265 | +5% $-204 | +10% $-144 |
| Rate | -1.0pp $-154 | -0.5pp $-209 | base $-265 | +0.5pp $-322 | +1.0pp $-380 |
UW: 25.0% down · 7.5% · 30yr · 1.5% tax · 5.0% vac · 8.0% maint · 8.0% mgmt
Financing live
Cash to close
- Down payment
- $55,000
- Closing costs
- $6,600
- Reserves months
- —
- Total cash needed
- —
Loan-product check · same deal, 3 products live
Conventional
25% down · 7.5% · 30yr
- Down + closing
- —
- Monthly P&I
- —
- Monthly cashflow
- —
- DSCR
- —
- Eligible?
- —
Personal DTI + credit; lowest rate.
DSCR
20% down · 8.5% · 30yr
- Down + closing
- —
- Monthly P&I
- —
- Monthly cashflow
- —
- DSCR
- —
- Eligible?
- —
No personal income docs; deal must DSCR.
Hard money
10% down · 12.0% · 12mo
- Down + closing
- —
- Monthly P&I
- —
- Monthly cashflow
- —
- DSCR
- —
- Eligible?
- —
Short-term bridge; refi at stabilization.
Rent comps 7 comps
| Address | Beds | Baths | Sqft | Rent | $/sqft | DOM | Units | Dist |
|---|---|---|---|---|---|---|---|---|
| 21 E Lancaster St Red Lion, PA | 2.0 | 1.0 | 900 | $1,295 | $1.44 | 45d | 1 | 0.08mi |
| 305 W Broadway Red Lion, PA | 2.0 | 1.0 | 968 | $1,395 | $1.44 | 45d | 1 | 0.42mi |
| 16 W High St Red Lion, PA | 3.0 | 1.0 | 1075 | $1,075 | $1.00 | 22d | 1 | 0.44mi |
| 705 Country Club Rd Red Lion, PA | 3.0 | 2.5 | 1660 | $1,695 | $1.02 | 45d | 1 | 0.82mi |
| 703 Country Club Rd Red Lion, PA | 3.0 | 2.5 | 1540 | $1,795 | $1.17 | 45d | 1 | 0.83mi |
| 201 Burrows Rd Red Lion, PA | 3.0 | 2.5 | 1485 | $1,924 | $1.30 | 15d | 1 | 1.26mi |
| 118 W Main St Windsor, PA | 2.0 | 1.0 | 1402 | $1,150 | $0.82 | 22d | 1 | 1.33mi |
Listing history 5 events
-
2026-06-09status $220,000 Pending 5 DOM
-
2026-06-08days on market $220,000 Active 5 DOM
-
2026-06-07days on market $220,000 Active 4 DOM
-
2026-06-05remarks 699-char remark
-
2026-06-05$220,000 Active 1 DOM
ⓘ Source: listings_history table (triggers on properties + properties_extension) + one-shot
backfill from property_details.listing_events for pre-trigger history.
Tax reassessment forecast PA · Partial reset (capped growth)
- Current annual tax
- $2,693 · $224/mo
- Projected year-2 tax
- $3,085 · $257/mo
- Expected delta
- +$391/yr (+$33/mo · 14.5%)
ⓘ Screening estimate from a state-policy table — verify with the county assessor before closing.
Climate risk First Street
- Flood 1/10 Low FEMA zone X (unshaded) · 0% chance over 30 yrs
- Wildfire 1/10 Low
- Heat 5/10 Major 7 d/yr ≥100°F today · 15 d/yr by 30 yrs out
- Wind 4/10 Moderate 12% chance of damaging wind over 30 yrs
- Air quality 3/10 Moderate 2 unhealthy d/yr today · 5 by 30 yrs out
Nearby sold comps map
Loading sold comps map…
Walkable amenities ~0.75 mi
Loading nearby amenities…
Taxation est. · year 1
- Rental income
- $18,308
- − Mortgage interest
- −$12,323
- − Property taxes
- −$2,693
- − Insurance
- −$1,100
- − Repairs & maintenance
- −$1,465
- − Management
- −$1,465
- − Depreciation
- −$6,400
- Taxable loss
- −$7,138
- Est. tax savings @ 24.0%
- +$1,713
- After-tax cash flow
- $-1,461/yr
For passive investors: Depreciation is non-cash, so a rental often shows a tax loss while cash-flowing — sheltering income. Rental losses are passive: they offset passive income freely, and up to $25,000/yr can offset ordinary (W-2) income if you actively participate and your MAGI is under $100k (phasing out to $0 by $150k); unused losses carry forward. On sale, claimed depreciation is recaptured at up to 25%, and gains may owe capital-gains tax (a 1031 exchange can defer both). Figures are a year-1 estimate at your 24.0% rate — not tax advice; consult a CPA.
Schools (NCES district)
- District
- Red Lion Area SD
- NCES district ID
- 4220100
- Math proficiency
- 36% ▼ -10.00%
- Reading proficiency
- 50% ▼ -10.00%
- Median HH income
- $60,225
- Composite
- 37.91/100
- National rank
- #4313
- State rank
- #282 of 539 in PA
Livability — Red Lion
- Score
- 77/100
- State rank
- #349
- US rank
- #3056
Category grades
Schools grade is shown separately in the Schools card above.
Census & demographics
- Census place
- Red Lion, PA
- County
- York County · 278,806 people
- City population
- 22,869
- Metro
- York-Hanover, PA
- Population (ZIP)
- 22,869
- Household income
- $86,561
- Rent vs Own
- Severe rent burden
- 559.0
Population outlook (York County) Hauer SSP2
- Today (2025)
- 454,205 people
- By 2030
- 457,407 · +0.7%
- By 2040
- 457,529 · +0.7%
- By 2050
- 448,261 · -1.3%
- By 2075
- 427,388 · -5.9%
- By 2100
- 384,218 · -15.4%
Race, ethnicity, and origin ACS 2023
- Neighborhood character
- Predominantly White (89%)
- Race & ethnicity
- White 89% Black 4% Two or more races 4% Asian 2% Hispanic / Latino 2%
- Common ancestry
- Romanian 3% Slovak 3% Serbian 2%
- Foreign-born
- 4% · China
- Languages at home
- 95% English-only · Russian/Polish/Slavic 1% Chinese 1% Other Indo-European 1%
Political lean MEDSL · York
- 2024 margin
- Strong R (+25.3) · D 36.9% · R 62.1%
- 2008→2024 swing
- -11.7pp toward R · 2008: -13.6pp · 2024: -25.3pp
- All cycles
- 2024: R+25.3 2020: R+24.6 2016: R+29.3 2012: R+21.2 2008: R+13.6
Not yet ingested
- Civics
- —
Market trends
- HPI YoY
- ▼ -69.16%
- Current HPI
- 259.7294
- Rent YoY
- —
- Metro
- York-Hanover, PA
- State GDP YoY
- ▲ 1.68%
- F500 in state
- 34
Industry mix (Fortune 500 HQ in PA)
| Industry | F500 HQs | Revenue |
|---|---|---|
| Healthcare | 2 | $309B |
|
||
| Insurance | 2 | $27B |
|
||
| Telecommunications / Media | 1 | $124B |
|
||
| Industrial Distribution | 1 | $22B |
|
||
| Financial Services | 1 | $20B |
|
||
| Chemicals / Materials | 1 | $18B |
|
||
Price history
+286.0% since first listed10 events — show timeline
- 2026-06-03 Listed $220,000 BRIGHT MLS
- 2008-06-05 Sold (Public Records) $110,500 Public Records
- 2008-05-09 Sold (MLS) $110,500 BRIGHT MLS
- 2008-04-01 Listing Removed — BRIGHT MLS
- 2007-11-29 Listed $113,000 BRIGHT MLS
- 1999-03-01 Sold (Public Records) $74,900 Public Records
- 1999-03-01 Sold (MLS) $74,900 BRIGHT MLS
- 1999-01-23 Listing Removed — BRIGHT MLS
- 1998-12-15 Listed $74,900 BRIGHT MLS
- 1996-08-19 Sold (Public Records) $57,000 Public Records
Property tax history
+0.9%/yrLatest (2025): $2,693 · +3.0% YoY. Source: county tax records.
Cash-flow waterfall
monthlySold comps — $/sqft
last 12 mo · ≤1 miLoading sold comps…