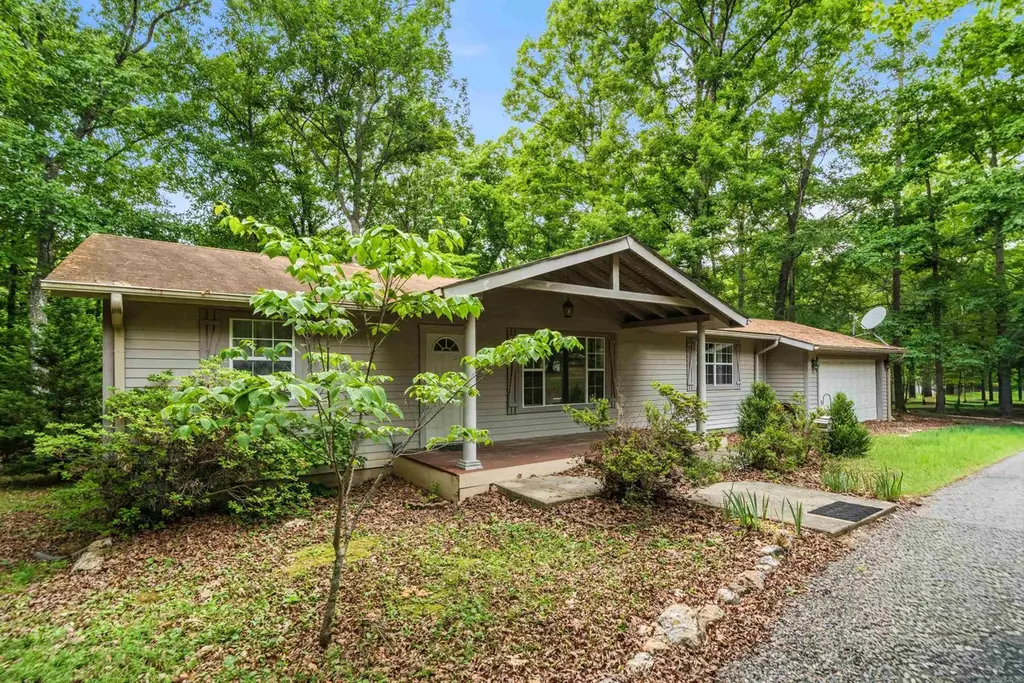
308 Lawrence Ln
Lake Hamilton, AR 71913
$189,000D
3 bd · 2.0 ba ·
1,456 sqft ·
Built 1999
· SingleFamily
· Active
· 25 DOM
Cashflow @ list (25.0% down · 7.5%)
Estimated rent
$1,403/mo
Mortgage (P&I)
−$991
Tax + insurance
−$145
HOA
−$0
Vac / Maint / Mgmt
−$295
Net cashflow
$-28/mo
Annual
$-330/yr
Cap rate
6.12%
Cash-on-cash
-0.62%
DSCR
0.97
1% rule
0.74%
Cash to close
$52,920
Investor read
- This is a 3-bed/2.0-bath single-family listed at $189k.
- At list price, monthly cash flow is $-28 ($-330/yr) — negative.
- To cash-flow at today's rent, offer at most $184k (2.6% below list).
- To meet the 1% rule (rent ≥ 1% of price), the offer needs to be $140k (25.8% below list).
- It's been on market 25 days — a 2% lower offer ($186k) is reasonable based on typical stale-listing flexibility.
- Recommended offer: $140k (25.8% below list) — sets the bar for 1% rule.
- Local home prices are declining (-3.0%/yr); year-one equity from $1k of loan paydown is wiped out by about $6k of value loss. Plan a longer hold.
- Location reads 59/100 on livability (#296 in AR) — a working-class tenant base; expect higher turnover. Strengths: crime A+, cost of living B; Watch: employment C-, amenities F, commute F.
- Bismarck School District (rural): math 51% / reading 53% proficiency, ranked #14 of 238 in AR (top 6%) — acceptable for families but not a draw, mixed tenant base, ~2y average lease.
- Zoned schools: Bismarck Elementary School (math 57% / reading 47%, grade C-, #77 of 454 statewide, top 19%, 391 students, 65% FRL); Bismarck Middle School (math 52% / reading 55%, grade C+, #25 of 201 statewide, top 12%, 321 students, 70% FRL); Bismarck High School (math 42% / reading 52%, grade D-, #19 of 292 statewide, top 7%, 308 students, 62% FRL).
- Market conditions: Rents rising fast (+6.4%/yr); 981 active listings in the ZIP; 4 units permitted in Hot Spring County in 2024 (0 in 5+ unit buildings).
- Hot Spring County population projected to shrink 3% by 2050 — rents likely to lag national; underwrite the cash flow, not the appreciation.
- 4 sale attempts since 4y ago with the ask held roughly flat each time — persistent listings suggest the price (not the market) is what's stuck; bring a comps-based counter.
- Climate carrying-cost: extreme-heat days projected 7→21/yr by 2055 (HVAC capex compounding) — expect insurance premiums to compound above CPI over the hold.
- Cap rate 6.1% vs local median 1.0% in Lake Hamilton — top-decile yield for the area; either an underpriced asset or a hidden risk that comps aren't pricing in. Stress-test before assuming the spread holds.
- This rent runs 30% of the median local income ($56k/yr) — at the standard rent-burdened threshold; future hikes will face affordability resistance.
Questions for listing agent
- What do current leases actually rent for vs. the listed asking? Can we see a recent rent roll and the last 12 months of T-12 income?
- Is there a deadline driving the sale (1031 exchange, divorce, estate, relocation)? That informs how much negotiation room exists.
- Schools are F-rated, which usually means shorter tenancies and higher turnover. Who's the typical renter profile here, and what's been the actual vacancy rate?
- The area grade is low — what's the realistic commute time and amenity access for the typical tenant pool here? Any planned neighborhood developments (good or bad) we should know about?
- What's the average days-on-market for RENTAL listings here right now (not sales)? A rising rental-DOM trend means longer vacancies and softer asking-rent achievability than the comps imply.
- What's the recent tenant-quality profile in this submarket — average credit score on applications, eviction rate, late-payment / NSF rate, and stable-employment percentage? A property-management company in the area should have these aggregated.
- How much new for-sale + rental construction is in the pipeline within 1–3 miles? Heavy new supply typically softens prices + rents 12–24 months out; constrained supply supports both.
CashFlowRE · CFR-366CR49T2G4AJH
· Data 2 days ago
cashflowre.app · 2026-05-29