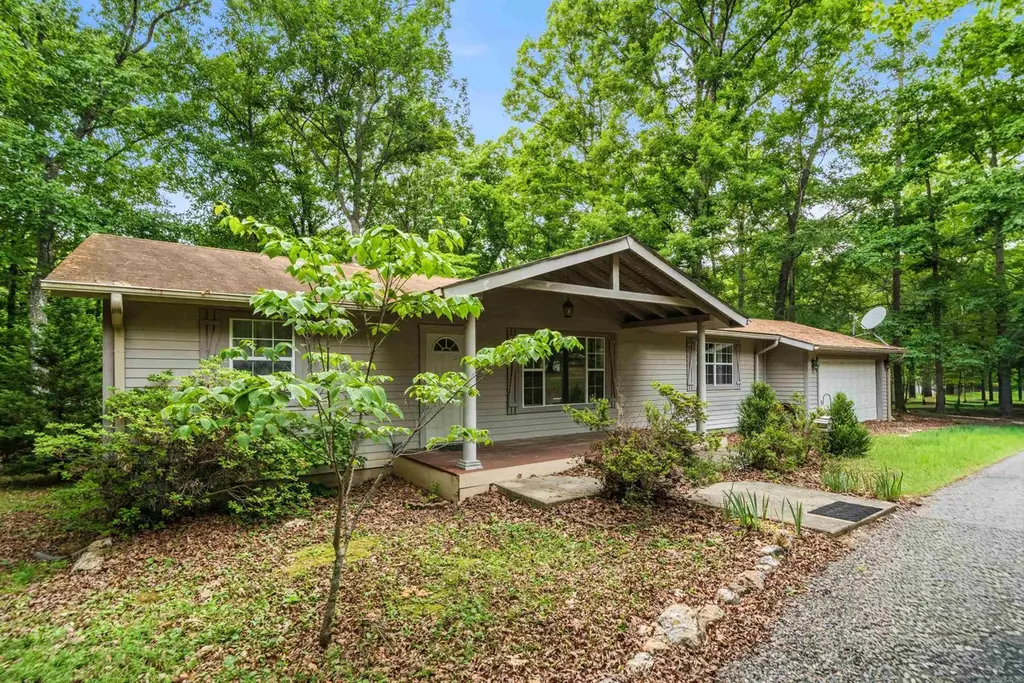
308 Lawrence Ln · Lake Hamilton, AR
Flood risk 1/10 · Minimal
- FEMA flood zone
- X (unshaded)
- Chance of flooding over 30 yrs
- 0.0%
- Est. flood insurance / yr
- $507 – $1,088
Fire risk 3/10 · Minor
- Est. fire insurance / yr
- $1,499 – $2,785
Heat risk 6/10 · Moderate
- Hot days now (above 110°F)
- 7 days/yr
- Hot days in 30 yrs
- 21 days/yr
Wind risk 4/10 · Minor
- Chance of severe wind over 30 yrs
- 9.0%
Air-quality risk 1/10 · Minimal
- Unhealthy air days now
- 0 days/yr
- Unhealthy air days in 30 yrs
- 0 days/yr
Risk factors via First Street. Map © Google.
Why this score? — see what drove the D grade
The composite is a weighted blend of 9 inputs, each scored 0–100. Each bar is that input's sub-score; the figure is the points it added to the 100-point composite (weight × sub-score).
- Cash flow +12.5/30.0
- ARV discount +7.5/15.0
- Schools +4.4/10.0
- Rent growth +4.1/5.0
- DSCR +3.7/10.0
- Livability +3.0/5.0
- Condition / age +2.5/5.0
- 1% rule +2.4/10.0
- Appreciation +0.0/10.0
$189,000
🖨 Deal sheet (PDF) 📄 Offer letter ✓ Due diligence
Listing remarks
Don't miss this charming 3-bedroom, 2-bathroom home, ideally located near all the attractions Hot Springs has to offer! Set on a peaceful half-acre lot, this property features a convenient separate laundry room, a large fenced backyard, and generously sized bedrooms. Whether you're a first-time buyer, growing family, or investor, this one has incredible potential. Come check it out today!
Key facts
- Detached
- 0.55 acre lot
- 2 parking spots
Tags
Property features AI
Exterior
- Parking: 2-car parking
- Utilities: Septic system; Private well; Electric service (municipal/Entergy)
- Home design: Single-family property
- Construction: Composition roof; Crawl space foundation
- Exterior features: Wood exterior; Level lot; Paved road access
Interior
- Kitchen: Microwave; Dishwasher
- Flooring: Carpet; Tile
- Bathrooms: 2 full bathrooms
- Heating & cooling: Central electric heating; Central electric cooling
- Interior features: Carpet and tile flooring; Laundry room
- Laundry & utility: Laundry room
Neighborhood map
What this means for you Summary
Snapshot
- This is a 3-bed/2.0-bath single-family listed at $189k.
Deal economics
- At list price, monthly cash flow is $-28 ($-330/yr) — negative.
- To cash-flow at today's rent, offer at most $184k (2.6% below list).
- To meet the 1% rule (rent ≥ 1% of price), the offer needs to be $140k (25.8% below list).
- Recommended offer: $140k (25.8% below list) — sets the bar for 1% rule.
- Cap rate 6.1% vs local median 1.0% in Lake Hamilton — top-decile yield for the area; either an underpriced asset or a hidden risk that comps aren't pricing in. Stress-test before assuming the spread holds.
Location & tenants
- Location reads 59/100 on livability (#296 in AR) — a working-class tenant base; expect higher turnover. Strengths: crime A+, cost of living B; Watch: employment C-, schools F, amenities F.
- Bismarck School District (rural): math 51% / reading 53% proficiency, ranked #14 of 238 in AR (top 6%) — acceptable for families but not a draw, mixed tenant base, ~2y average lease.
- Market conditions: Rents rising fast (+6.4%/yr); 981 active listings in the ZIP; 4 units permitted in Hot Spring County in 2024 (0 in 5+ unit buildings).
- This rent runs 30% of the median local income ($56k/yr) — at the standard rent-burdened threshold; future hikes will face affordability resistance.
Forward outlook
- Local home prices are declining (-3.0%/yr); year-one equity from $1k of loan paydown is wiped out by about $6k of value loss. Plan a longer hold.
- Hot Spring County population projected to shrink 3% by 2050 — rents likely to lag national; underwrite the cash flow, not the appreciation.
Negotiation context
- It's been on market 25 days — a 2% lower offer ($186k) is reasonable based on typical stale-listing flexibility.
- 4 sale attempts since 4y ago with the ask held roughly flat each time — persistent listings suggest the price (not the market) is what's stuck; bring a comps-based counter.
Risks & watch-outs
- Climate carrying-cost: extreme-heat days projected 7→21/yr by 2055 (HVAC capex compounding) — expect insurance premiums to compound above CPI over the hold.
Questions for the listing agent
- What do current leases actually rent for vs. the listed asking? Can we see a recent rent roll and the last 12 months of T-12 income?
- Is there a deadline driving the sale (1031 exchange, divorce, estate, relocation)? That informs how much negotiation room exists.
- Schools are F-rated, which usually means shorter tenancies and higher turnover. Who's the typical renter profile here, and what's been the actual vacancy rate?
- The area grade is low — what's the realistic commute time and amenity access for the typical tenant pool here? Any planned neighborhood developments (good or bad) we should know about?
- What's the average days-on-market for RENTAL listings here right now (not sales)? A rising rental-DOM trend means longer vacancies and softer asking-rent achievability than the comps imply.
- What's the recent tenant-quality profile in this submarket — average credit score on applications, eviction rate, late-payment / NSF rate, and stable-employment percentage? A property-management company in the area should have these aggregated.
- How much new for-sale + rental construction is in the pipeline within 1–3 miles? Heavy new supply typically softens prices + rents 12–24 months out; constrained supply supports both.
Investment metrics
- 1% rule
- 0.74% ✗
- Cap rate
- 6.12%
- Cash-on-cash
- -0.62%
- DSCR
- 0.97
- GRM
- 11.2
CMA / ARV
No comps found within radius.
Projected returns pro-forma
-3.0% appreciation · 6.43% rent growth · sell at horizon
- IRR
- -14.1%
- Equity multiple
- 0.48×
- Total profit
- $-27,454
- Equity at exit
- $28,181
- IRR
- -1.1%
- Equity multiple
- 0.92×
- Total profit
- $-4,448
- Equity at exit
- $16,341
Cash invested: $52,920 (down + closing). Projections, not guarantees.
Landlord ↔ Tenant lean methodology
- Overall (STATE)
- 92 Strongly Landlord-Friendly
- State Arkansas
- 92 Strongly Landlord-Friendly · R+14
- County
- — inherits STATE
- City
- — inherits STATE
ZIP-level market 71913
- Home prices YoY
- -33.9%
- Rents YoY
- 6.4%
- Active inventory
- 981
- Price-to-rent
- 11.2×
Monthly cashflow live
- Estimated rent
- $1,403 medium interval (Pro) →
- Mortgage (P&I)
- −$991
- Tax from tax record
- −$66 /mo · $791/yr
- Insurance
- −$79
- HOA
- −$0
- Vacancy / Maint / Mgmt
- −$295
- Net cashflow
- $-28
Break-even live
Sensitivity live
| Price | -10% $79 | -5% $26 | +0% $-28 | +5% $-81 | +10% $-135 |
|---|---|---|---|---|---|
| Rent | -10% $-138 | -5% $-83 | +0% $-28 | +5% $28 | +10% $83 |
| Rate | -1.0pp $68 | -0.5pp $21 | base $-28 | +0.5pp $-76 | +1.0pp $-126 |
UW: 25.0% down · 7.5% · 30yr · 1.5% tax · 5.0% vac · 8.0% maint · 8.0% mgmt
Financing live
Cash to close
- Down payment
- $47,250
- Closing costs
- $5,670
- Reserves months
- —
- Total cash needed
- —
Loan-product check · same deal, 3 products live
Conventional
25% down · 7.5% · 30yr
- Down + closing
- —
- Monthly P&I
- —
- Monthly cashflow
- —
- DSCR
- —
- Eligible?
- —
Personal DTI + credit; lowest rate.
DSCR
20% down · 8.5% · 30yr
- Down + closing
- —
- Monthly P&I
- —
- Monthly cashflow
- —
- DSCR
- —
- Eligible?
- —
No personal income docs; deal must DSCR.
Hard money
10% down · 12.0% · 12mo
- Down + closing
- —
- Monthly P&I
- —
- Monthly cashflow
- —
- DSCR
- —
- Eligible?
- —
Short-term bridge; refi at stabilization.
Listing history 31 events
-
2026-06-19days on market $189,000 Active 25 DOM
-
2026-06-18days on market $189,000 Active 24 DOM
-
2026-06-17days on market $189,000 Active 23 DOM
-
2026-06-16days on market $189,000 Active 22 DOM
-
2026-06-15days on market $189,000 Active 21 DOM
-
2026-06-14days on market $189,000 Active 19 DOM
-
2026-06-13days on market $189,000 Active 18 DOM
-
2026-06-10days on market $189,000 Active 16 DOM
-
2026-06-09days on market $189,000 Active 15 DOM
-
2026-06-08days on market $189,000 Active 14 DOM
-
2026-06-07days on market $189,000 Active 13 DOM
-
2026-06-02days on market $189,000 Active 8 DOM
-
2026-06-01statusdays on market $189,000 Active 7 DOM
-
2026-05-31days on market $189,000 New Listing 6 DOM
-
2026-05-30days on market $189,000 New Listing 5 DOM
-
2026-05-25$189,000 New Listing
-
2025-06-17historical
-
2025-03-14$189,000 New Listing
-
2025-03-06historical
-
2025-02-22price $189,000
-
2025-02-06$199,000 New Listing
-
2022-06-01soldstatus $180,000
-
2022-05-26soldstatus $180,000 Sold
-
2022-05-26soldstatus $180,000
-
2022-04-28status Under Contract
-
2022-04-25$185,000 New Listing
-
2007-04-12soldstatus $136,500
-
2005-11-04soldstatus $116,000
-
2001-08-22soldstatus $85,000
-
1999-06-29soldstatus $75,000
-
1998-04-22soldstatus $9,000
ⓘ Source: listings_history table (triggers on properties + properties_extension) + one-shot
backfill from property_details.listing_events for pre-trigger history.
Tax reassessment forecast AR · Resets to sale price
- Current annual tax
- $791 · $66/mo
- Projected year-2 tax
- $1,210 · $101/mo
- Expected delta
- +$419/yr (+$35/mo · 52.9%)
ⓘ Screening estimate from a state-policy table — verify with the county assessor before closing.
Climate risk First Street
- Flood 1/10 Low FEMA zone X (unshaded) · 0% chance over 30 yrs
- Wildfire 3/10 Moderate
- Heat 6/10 Major 7 d/yr ≥110°F today · 21 d/yr by 30 yrs out
- Wind 4/10 Moderate 9% chance of damaging wind over 30 yrs
- Air quality 1/10 Low 0 unhealthy d/yr today · 0 by 30 yrs out
Nearby sold comps map
Loading sold comps map…
Walkable amenities ~0.75 mi
Loading nearby amenities…
Taxation est. · year 1
- Rental income
- $16,835
- − Mortgage interest
- −$10,587
- − Property taxes
- −$791
- − Insurance
- −$945
- − Repairs & maintenance
- −$1,347
- − Management
- −$1,347
- − Depreciation
- −$5,498
- Taxable loss
- −$3,680
- Est. tax savings @ 24.0%
- +$883
- After-tax cash flow
- $553/yr
For passive investors: Depreciation is non-cash, so a rental often shows a tax loss while cash-flowing — sheltering income. Rental losses are passive: they offset passive income freely, and up to $25,000/yr can offset ordinary (W-2) income if you actively participate and your MAGI is under $100k (phasing out to $0 by $150k); unused losses carry forward. On sale, claimed depreciation is recaptured at up to 25%, and gains may owe capital-gains tax (a 1031 exchange can defer both). Figures are a year-1 estimate at your 24.0% rate — not tax advice; consult a CPA.
Schools (NCES district)
- District
- Bismarck School District
- NCES district ID
- 0503240
- Math proficiency
- 51% ▼ -23.00%
- Reading proficiency
- 53% ▼ -14.00%
- Median HH income
- $42,486
- Composite
- 43.73/100
- National rank
- #2948
- State rank
- #14 of 238 in AR
Livability — Lake Hamilton
- Score
- 59/100
- State rank
- #296
- US rank
- #20336
Category grades
Schools grade is shown separately in the Schools card above.
Census & demographics
- County
- Garland County · 76,414 people
- Metro
- Hot Springs, AR
- Population (ZIP)
- 47,477
- Household income
- $56,010
- Rent vs Own
- Severe rent burden
- 1442.0
Population outlook (Hot Spring County) Hauer SSP2
- Today (2025)
- 34,464 people
- By 2030
- 34,659 · +0.6%
- By 2040
- 34,486 · +0.1%
- By 2050
- 33,419 · -3.0%
- By 2075
- 28,702 · -16.7%
- By 2100
- 21,415 · -37.9%
Race, ethnicity, and origin ACS 2023
- Neighborhood character
- Predominantly White (79%)
- Race & ethnicity
- White 79% Hispanic / Latino 8% Black 8% Two or more races 6% Asian 1%
- Hispanic origin (detail)
- Mexican 6%
- Common ancestry
- Italian 3% Lithuanian 2% Slovak 2%
- Foreign-born
- 5% · Canada
- Languages at home
- 91% English-only · Spanish 7% Other Indo-European 1%
Political lean MEDSL · Hot Spring
- 2024 margin
- Solid R (+52.2) · D 22.9% · R 75.1% · Other 1.9%
- 2008→2024 swing
- -27.7pp toward R · 2008: -24.4pp · 2024: -52.2pp
- All cycles
- 2024: R+52.2 2020: R+48.7 2016: R+42.5 2012: R+29.0 2008: R+24.4
Not yet ingested
- Civics
- —
Market trends
- HPI YoY
- ▼ -137.67%
- Current HPI
- 268.5228
- Rent YoY
- ▲ 6.43%
- Metro
- Hot Springs, AR
- State GDP YoY
- ▲ 3.80%
- F500 in state
- 10
Industry mix (Fortune 500 HQ in AR)
| Industry | F500 HQs | Revenue |
|---|---|---|
| Retail | 1 | $681B |
|
||
| Food / Agriculture | 1 | $53B |
|
||
| Retail / Energy | 1 | $22B |
|
||
| Transportation / Logistics | 1 | $12B |
|
||
| Energy | 1 | $4B |
|
||
Price history
+2000.0% since first listed16 events — show timeline
- 2026-05-25 Listed $189,000 CARMLS
- 2025-06-17 Listing Removed — CARMLS
- 2025-03-14 Listed $189,000 CARMLS
- 2025-03-06 Listing Removed — CARMLS
- 2025-02-22 Price Changed $189,000 CARMLS
- 2025-02-06 Listed $199,000 CARMLS
- 2022-06-01 Sold (MLS) $180,000 HSBOR
- 2022-05-26 Sold (Public Records) $180,000 Public Records
- 2022-05-26 Sold (MLS) $180,000 CARMLS
- 2022-04-28 Pending — CARMLS
- 2022-04-25 Listed $185,000 CARMLS
- 2007-04-12 Sold (Public Records) $136,500 Public Records
- 2005-11-04 Sold (Public Records) $116,000 Public Records
- 2001-08-22 Sold (Public Records) $85,000 Public Records
- 1999-06-29 Sold (Public Records) $75,000 Public Records
- 1998-04-22 Sold (Public Records) $9,000 Public Records
Property tax history
-0.6%/yrLatest (2024): $791 · -8.0% YoY. Source: county tax records.
Cash-flow waterfall
monthlySold comps — $/sqft
last 12 mo · ≤1 miLoading sold comps…