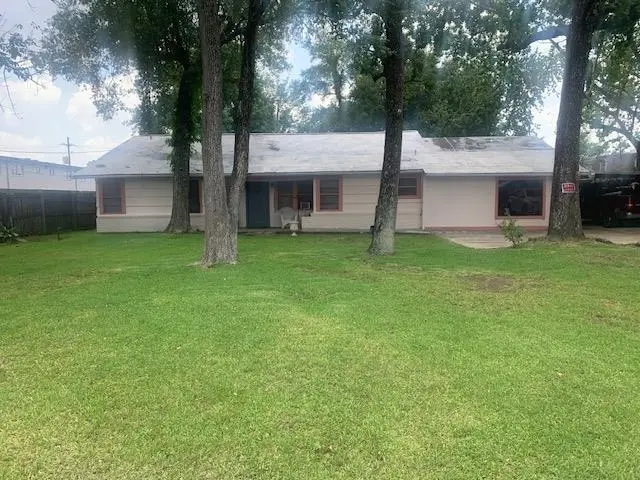
2615 Sweetgum Ln
Beaumont, TX 77703
$50,000B
3 bd · 2.0 ba ·
2,226 sqft ·
Built 2013
· SingleFamily
· Pending
Cashflow @ list (25.0% down · 7.5%)
Estimated rent
$1,792/mo
Mortgage (P&I)
−$262
Tax + insurance
−$35
HOA
−$0
Vac / Maint / Mgmt
−$376
Net cashflow
$1,118/mo
Annual
$13,412/yr
Cap rate
33.12%
Cash-on-cash
95.80%
DSCR
5.26
1% rule
3.58%
Cash to close
$14,000
Investor read
- This is a 3-bed/2.0-bath single-family listed at $50k.
- At list price, monthly cash flow is $1k ($13k/yr) — positive.
- The deal already cash-flows at list — no discount required.
- Meets the 1% rule at list price ($2k rent vs $50k).
- Only 0 days on market — expect competitive offers; lowballing is unlikely to land.
- In year one you build about $3k of equity ($346 loan paydown + $3k appreciation (5.4% local appreciation)).
- Location reads 64/100 on livability (#739 in TX) — a middle-class / working-renter tenant base. Strengths: cost of living A+, housing A+, health & safety A+; Watch: employment D, schools D-, crime F.
- Beaumont ISD (urban): math 14% / reading 22% proficiency, ranked #789 of 826 in TX (top 96%) — low school quality limits family demand, transient renter base, plan for 1-2y turnover; 69% free/reduced lunch — lower-income household profile, screen leases tightly.
- Market conditions: 79 active listings in the ZIP; 10 comparable units currently listed for rent nearby; rentals at typical pace (median 24d on market — plan ~3-4 weeks tenant-placement turnaround); 40% of comp listings sitting > 30 days — soft ceiling on asking rent; lower-income renter base — watch delinquency; 343 units permitted in Jefferson County in 2024 (0 in 5+ unit buildings).
- At projected returns (5.4% appreciation + 3.0% rent growth), your $14k cash investment doubles in ~1 year — after that, you're playing with house money.
- By year 10, paydown + projected appreciation supports a ~$31k cash-out refi (75% LTV) — recoverable capital for the next deal without selling this one.
- Cap rate 33.1% vs local median 5.3% in Beaumont — top-decile yield for the area; either an underpriced asset or a hidden risk that comps aren't pricing in. Stress-test before assuming the spread holds.
- At $1,792/mo this rent would consume 68% of the median local household income ($32k/yr) (locally 657% of renters already pay >50% of income on rent) — very limited rent-growth headroom before tenants either downsize or default.
Questions for listing agent
- Is there a deadline driving the sale (1031 exchange, divorce, estate, relocation)? That informs how much negotiation room exists.
- Schools are D-rated, which usually means shorter tenancies and higher turnover. Who's the typical renter profile here, and what's been the actual vacancy rate?
- Crime grade is F in this area — have there been break-ins, vandalism, or insurance claims at this property in the last 3 years? What carrier currently insures it and at what premium?
- What's the average days-on-market for RENTAL listings here right now (not sales)? A rising rental-DOM trend means longer vacancies and softer asking-rent achievability than the comps imply.
- What's the recent tenant-quality profile in this submarket — average credit score on applications, eviction rate, late-payment / NSF rate, and stable-employment percentage? A property-management company in the area should have these aggregated.
- How much new for-sale + rental construction is in the pipeline within 1–3 miles? Heavy new supply typically softens prices + rents 12–24 months out; constrained supply supports both.
CashFlowRE · CFR-37G30H4XSFDFAK
· Data 2 days ago
cashflowre.app · 2026-05-29