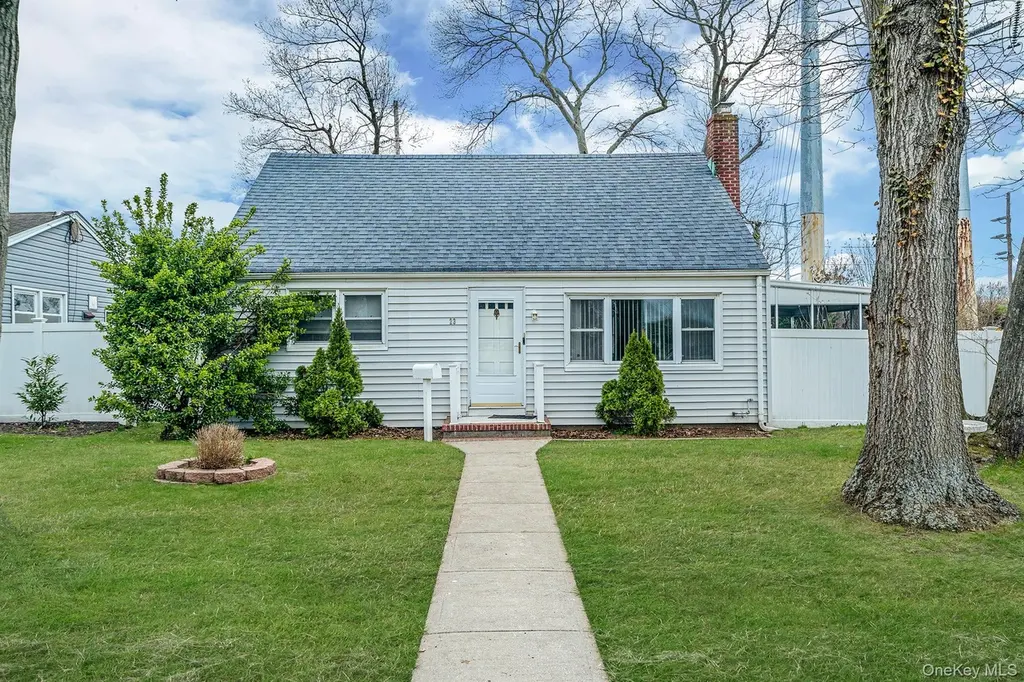
23 Lakewood Ave
Lake Ronkonkoma, NY 11779
$539,000C-
4 bd · 2.0 ba ·
1,822 sqft ·
Built 1954
· SingleFamily
· Pending
· 23 DOM
Cashflow @ list (25.0% down · 7.5%)
Estimated rent
$4,478/mo
Mortgage (P&I)
−$2,827
Tax + insurance
−$664
HOA
−$0
Vac / Maint / Mgmt
−$940
Net cashflow
$47/mo
Annual
$560/yr
Cap rate
6.40%
Cash-on-cash
0.37%
DSCR
1.02
1% rule
0.83%
Cash to close
$150,920
Investor read
- This is a 4-bed/2.0-bath single-family listed at $539k.
- At list price, monthly cash flow is $47 ($560/yr) — positive.
- The deal already cash-flows at list — no discount required.
- To meet the 1% rule (rent ≥ 1% of price), the offer needs to be $448k (16.9% below list).
- It's been on market 23 days — a 2% lower offer ($531k) is reasonable based on typical stale-listing flexibility.
- Recommended offer: $448k (16.9% below list) — sets the bar for 1% rule.
- Local home prices are declining (-3.0%/yr); year-one equity from $4k of loan paydown is wiped out by about $16k of value loss. Plan a longer hold.
- Location reads 78/100 on livability (#169 in NY, #2,606 nationally) — a middle-class / working-renter tenant base. Strengths: employment A+, housing A+, schools B+; Watch: amenities D-, cost of living F.
- Sachem Central School District (suburban): math 69% / reading 76% proficiency, ranked #86 of 590 in NY (top 15%) — strong family-tenant draw, lease renewals of 3-5y typical; only 15% free/reduced lunch — higher-income household profile.
- Watch-outs: built in 1954 — expect roof / HVAC / electrical / plumbing capex.
- Market conditions: Rents flat; 174 active listings in the ZIP; 3 comparable units currently listed for rent nearby; rentals at typical pace (median 25d on market — plan ~3-4 weeks tenant-placement turnaround); high-income renter base; 1,366 units permitted in Suffolk County in 2024 (216 in 5+ unit buildings).
- Suffolk County population projected to shrink 5% by 2050 — rents likely to lag national; underwrite the cash flow, not the appreciation.
- Climate carrying-cost: major wind risk, 77% chance of damaging wind over 30y; extreme-heat days projected 7→17/yr by 2055 (HVAC capex compounding) — expect insurance premiums to compound above CPI over the hold.
- Cap rate 6.4% vs local median 4.0% in Lake Ronkonkoma — top-decile yield for the area; either an underpriced asset or a hidden risk that comps aren't pricing in. Stress-test before assuming the spread holds.
- At $4,478/mo this rent would consume 48% of the median local household income ($112k/yr) (locally 874% of renters already pay >50% of income on rent) — very limited rent-growth headroom before tenants either downsize or default.
Questions for listing agent
- Built in 1954 — when were the roof, HVAC, electrical panel, plumbing, and water heater last replaced?
- Is there a deadline driving the sale (1031 exchange, divorce, estate, relocation)? That informs how much negotiation room exists.
- Schools are B-rated — typically a magnet for longer-tenancy family renters. What's the average tenant stay here, and is there a school-zone premium baked into asking?
- What's the average days-on-market for RENTAL listings here right now (not sales)? A rising rental-DOM trend means longer vacancies and softer asking-rent achievability than the comps imply.
- What's the recent tenant-quality profile in this submarket — average credit score on applications, eviction rate, late-payment / NSF rate, and stable-employment percentage? A property-management company in the area should have these aggregated.
- How much new for-sale + rental construction is in the pipeline within 1–3 miles? Heavy new supply typically softens prices + rents 12–24 months out; constrained supply supports both.
CashFlowRE · CFR-39ZSD42X83WTHK
· Data 3 weeks ago
cashflowre.app · 2026-05-29