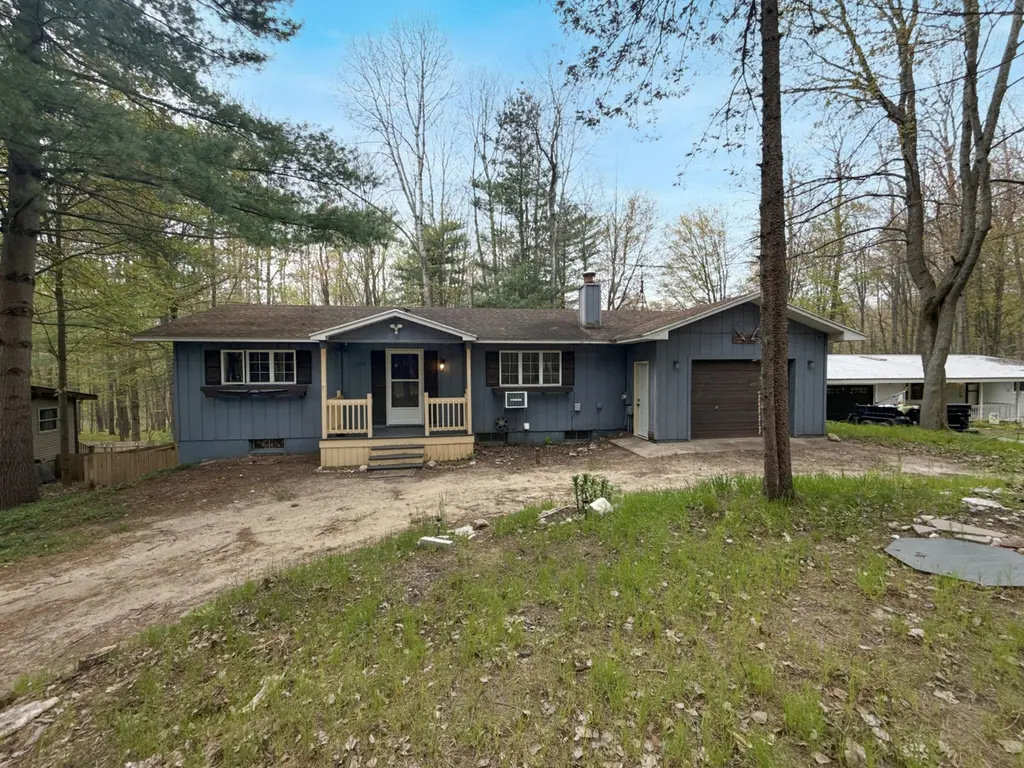
8281 Pine Tree Trl
Austin, MI 49346
$249,900D-
4 bd · 3.0 ba ·
1,920 sqft ·
Built 1973
· SingleFamily
· Active
· 21 DOM
Cashflow @ list (25.0% down · 7.5%)
Estimated rent
$2,000/mo
Mortgage (P&I)
−$1,311
Tax + insurance
−$416
HOA
−$75
Vac / Maint / Mgmt
−$420
Net cashflow
$-222/mo
Annual
$-2,664/yr
Cap rate
5.23%
Cash-on-cash
-3.81%
DSCR
0.83
1% rule
0.80%
Cash to close
$69,972
Investor read
- This is a 4-bed/3.0-bath single-family listed at $250k.
- At list price, monthly cash flow is $-222 ($-3k/yr) — negative.
- To cash-flow at today's rent, offer at most $218k (12.9% below list).
- To meet the 1% rule (rent ≥ 1% of price), the offer needs to be $200k (20.0% below list).
- It's been on market 21 days — a 2% lower offer ($246k) is reasonable based on typical stale-listing flexibility.
- Recommended offer: $200k (20.0% below list) — sets the bar for 1% rule.
- Local home prices are declining (-3.0%/yr); year-one equity from $2k of loan paydown is wiped out by about $7k of value loss. Plan a longer hold.
- Location reads: area grade D — affects rentability + tenant quality, not the cash-flow math above.
- Morley Stanwood Community Schools (rural): math 24% / reading 33% proficiency, ranked #390 of 540 in MI (top 72%) — low school quality limits family demand, transient renter base, plan for 1-2y turnover.
- Zoned schools: Morley Stanwood Elementary School (math 25% / reading 30%, grade F, #919 of 1,397 statewide, top 66%, 461 students, 74% FRL); Morley Stanwood Middle School (math 26% / reading 38%, grade F, #317 of 493 statewide, top 65%, 226 students, 66% FRL); Morley Stanwood High School (math 12% / reading 32%, grade F, #582 of 713 statewide, top 83%, 362 students, 60% FRL).
- Market conditions: 198 active listings in the ZIP; 1 comparable units currently listed for rent nearby; 116 units permitted in Mecosta County in 2024 (0 in 5+ unit buildings).
- Mecosta County population projected to shrink 9% by 2050 — rents likely to lag national; underwrite the cash flow, not the appreciation.
- 9 sale attempts since 3y ago with the ask held roughly flat each time — persistent listings suggest the price (not the market) is what's stuck; bring a comps-based counter.
Questions for listing agent
- What do current leases actually rent for vs. the listed asking? Can we see a recent rent roll and the last 12 months of T-12 income?
- Built in 1973 — when were the roof, HVAC, electrical panel, plumbing, and water heater last replaced?
- What does the HOA fee cover, when was the last increase, and are there any pending special assessments or reserve-fund shortfalls?
- Is there a deadline driving the sale (1031 exchange, divorce, estate, relocation)? That informs how much negotiation room exists.
- The area grade is low — what's the realistic commute time and amenity access for the typical tenant pool here? Any planned neighborhood developments (good or bad) we should know about?
- What's the average days-on-market for RENTAL listings here right now (not sales)? A rising rental-DOM trend means longer vacancies and softer asking-rent achievability than the comps imply.
- What's the recent tenant-quality profile in this submarket — average credit score on applications, eviction rate, late-payment / NSF rate, and stable-employment percentage? A property-management company in the area should have these aggregated.
- How much new for-sale + rental construction is in the pipeline within 1–3 miles? Heavy new supply typically softens prices + rents 12–24 months out; constrained supply supports both.
CashFlowRE · CFR-3AW06PFAWA73YX
· Data 3 weeks ago
cashflowre.app · 2026-05-29