8281 Pine Tree Trl · Austin, MI
Flood risk 1/10 · Minimal
- FEMA flood zone
- X (unshaded)
- Chance of flooding over 30 yrs
- 0.0%
- Est. flood insurance / yr
- $473 – $860
Fire risk 3/10 · Minor
- Est. fire insurance / yr
- $784 – $1,456
Heat risk 1/10 · Minimal
- Hot days now (above 95°F)
- 7 days/yr
- Hot days in 30 yrs
- 14 days/yr
Wind risk 1/10 · Minimal
- Chance of severe wind over 30 yrs
- —
Air-quality risk 2/10 · Minimal
- Unhealthy air days now
- 0 days/yr
- Unhealthy air days in 30 yrs
- 1 days/yr
Risk factors via First Street. Map © Google.
Why this score? — see what drove the D- grade
The composite is a weighted blend of 9 inputs, each scored 0–100. Each bar is that input's sub-score; the figure is the points it added to the 100-point composite (weight × sub-score).
- ARV discount +13.3/15.0
- Cash flow +8.4/30.0
- 1% rule +3.0/10.0
- Rent growth +2.5/5.0
- Livability +2.5/5.0
- Condition / age +2.5/5.0
- Schools +2.4/10.0
- DSCR +2.3/10.0
- Appreciation +0.0/10.0
$249,900
🖨 Deal sheet (PDF) 📄 Offer letter ✓ Due diligence
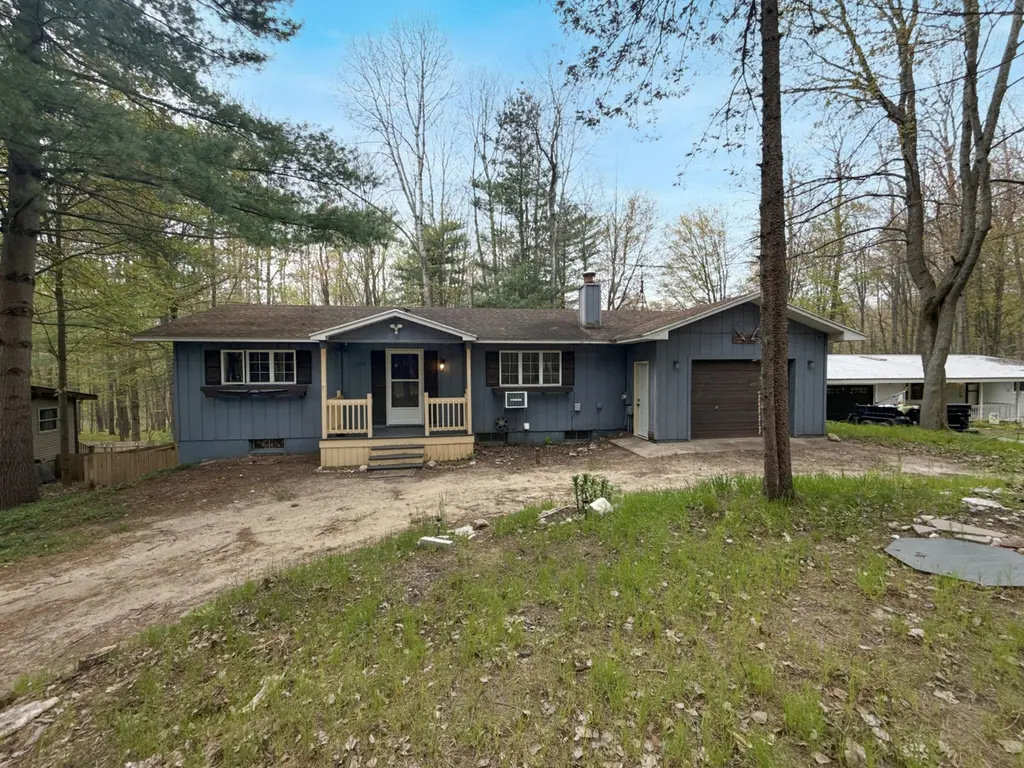
Listing remarks
Spacious walkout ranch in Canadian Lakes ready for its new owner! This 4-bedroom, 2 full bath, 2 half bath home features fresh paint and new flooring throughout. As you enter, you'll immediately notice the unique wood-burning fireplace in the living room, offering both character and plenty of warmth during the winter months. The fully finished lower level includes a large family room, second kitchen, additional bedrooms, and full bath, making it ideal for guests, extended living space, or entertaining. A bonus half bath and additional room just off the garage provide even more flexibility for a mudroom, workshop, home office, or extra storage space. Enjoy summer gatherings from the walkout
Key facts
- 0.29 acre lot
- 2 garage spots
- Community pool
Neighborhood map
What this means for you Summary
Snapshot
- This is a 4-bed/3.0-bath single-family listed at $250k.
Deal economics
- At list price, monthly cash flow is $-222 ($-3k/yr) — negative.
- To cash-flow at today's rent, offer at most $218k (12.9% below list).
- To meet the 1% rule (rent ≥ 1% of price), the offer needs to be $200k (20.0% below list).
- Recommended offer: $200k (20.0% below list) — sets the bar for 1% rule.
Location & tenants
- Location reads: area grade D — affects rentability + tenant quality, not the cash-flow math above.
- Morley Stanwood Community Schools (rural): math 24% / reading 33% proficiency, ranked #390 of 540 in MI (top 72%) — low school quality limits family demand, transient renter base, plan for 1-2y turnover.
- Zoned schools: Morley Stanwood Elementary School (math 25% / reading 30%, grade F, #919 of 1,397 statewide, top 66%, 461 students, 74% FRL); Morley Stanwood Middle School (math 26% / reading 38%, grade F, #317 of 493 statewide, top 65%, 226 students, 66% FRL); Morley Stanwood High School (math 12% / reading 32%, grade F, #582 of 713 statewide, top 83%, 362 students, 60% FRL).
- Market conditions: 198 active listings in the ZIP; 1 comparable units currently listed for rent nearby; 116 units permitted in Mecosta County in 2024 (0 in 5+ unit buildings).
Forward outlook
- Local home prices are declining (-3.0%/yr); year-one equity from $2k of loan paydown is wiped out by about $7k of value loss. Plan a longer hold.
- Mecosta County population projected to shrink 9% by 2050 — rents likely to lag national; underwrite the cash flow, not the appreciation.
Negotiation context
- It's been on market 21 days — a 2% lower offer ($246k) is reasonable based on typical stale-listing flexibility.
- 9 sale attempts since 3y ago with the ask held roughly flat each time — persistent listings suggest the price (not the market) is what's stuck; bring a comps-based counter.
Questions for the listing agent
- What do current leases actually rent for vs. the listed asking? Can we see a recent rent roll and the last 12 months of T-12 income?
- Built in 1973 — when were the roof, HVAC, electrical panel, plumbing, and water heater last replaced?
- What does the HOA fee cover, when was the last increase, and are there any pending special assessments or reserve-fund shortfalls?
- Is there a deadline driving the sale (1031 exchange, divorce, estate, relocation)? That informs how much negotiation room exists.
- The area grade is low — what's the realistic commute time and amenity access for the typical tenant pool here? Any planned neighborhood developments (good or bad) we should know about?
- What's the average days-on-market for RENTAL listings here right now (not sales)? A rising rental-DOM trend means longer vacancies and softer asking-rent achievability than the comps imply.
- What's the recent tenant-quality profile in this submarket — average credit score on applications, eviction rate, late-payment / NSF rate, and stable-employment percentage? A property-management company in the area should have these aggregated.
- How much new for-sale + rental construction is in the pipeline within 1–3 miles? Heavy new supply typically softens prices + rents 12–24 months out; constrained supply supports both.
Investment metrics
- 1% rule
- 0.80% ✗
- Cap rate
- 5.23%
- Cash-on-cash
- -3.81%
- DSCR
- 0.83
- GRM
- 10.4
CMA / ARV
- ARV (median comp)
- $287,174
- List price
- $249,900
- Delta
- -12.98%
- Verdict
- UNDERPRICED
- Comps
- 20 within 1.0 mi
Show comp detail 4 sales within ~0.75 mi
| Address | Dist | Beds/Ba | Sqft | Sold | Price | $/sf | Match |
|---|---|---|---|---|---|---|---|
| 8247 Tanglewood Trl | 0.07mi | 3/2.0 (-1) | 1,753 (-9%) | 4mo | $325,000 | $185 | 70 |
| 11650 13th St | 0.51mi | 3/3.0 (-1) | 1,990 (+4%) | 12mo | $289,500 | $145 | 55 |
| 11609 Twelfth St | 0.59mi | 3/3.0 (-1) | 1,988 (+4%) | 14mo | $255,000 | $128 | 50 |
| 8711 N Island Dr | 0.65mi | 3/3.0 (-1) | 2,029 (+6%) | 8mo | $530,000 | $261 | 49 |
Match score weights: distance 35% · size 25% · config 20% · recency 20%. Top-matched comps best support the ARV.
Projected returns pro-forma
-3.0% appreciation · 3.0% rent growth · sell at horizon
- IRR
- -22.7%
- Equity multiple
- 0.22×
- Total profit
- $-54,558
- Equity at exit
- $37,261
- IRR
- -16.9%
- Equity multiple
- 0.07×
- Total profit
- $-65,405
- Equity at exit
- $21,607
Cash invested: $69,972 (down + closing). Projections, not guarantees.
Landlord ↔ Tenant lean methodology
- Overall (STATE)
- 62 Landlord-Friendly
- State Michigan
- 62 Landlord-Friendly · EVEN
- County
- — inherits STATE
- City
- — inherits STATE
ZIP-level market 49346
- Home prices YoY
- -27.2%
- Active inventory
- 198
- Price-to-rent
- 10.4×
Monthly cashflow live
- Estimated rent
- $2,000 medium interval (Pro) →
- Mortgage (P&I)
- −$1,311
- Tax est. 1.5%
- −$312 /mo · $3,748/yr
- Insurance
- −$104
- HOA
- −$75
- Vacancy / Maint / Mgmt
- −$420
- Net cashflow
- $-222
Break-even live
Sensitivity live
| Price | -10% $-49 | -5% $-136 | +0% $-222 | +5% $-308 | +10% $-395 |
|---|---|---|---|---|---|
| Rent | -10% $-380 | -5% $-301 | +0% $-222 | +5% $-143 | +10% $-64 |
| Rate | -1.0pp $-96 | -0.5pp $-158 | base $-222 | +0.5pp $-287 | +1.0pp $-353 |
UW: 25.0% down · 7.5% · 30yr · 1.5% tax · 5.0% vac · 8.0% maint · 8.0% mgmt
Financing live
Cash to close
- Down payment
- $62,475
- Closing costs
- $7,497
- Reserves months
- —
- Total cash needed
- —
Loan-product check · same deal, 3 products live
Conventional
25% down · 7.5% · 30yr
- Down + closing
- —
- Monthly P&I
- —
- Monthly cashflow
- —
- DSCR
- —
- Eligible?
- —
Personal DTI + credit; lowest rate.
DSCR
20% down · 8.5% · 30yr
- Down + closing
- —
- Monthly P&I
- —
- Monthly cashflow
- —
- DSCR
- —
- Eligible?
- —
No personal income docs; deal must DSCR.
Hard money
10% down · 12.0% · 12mo
- Down + closing
- —
- Monthly P&I
- —
- Monthly cashflow
- —
- DSCR
- —
- Eligible?
- —
Short-term bridge; refi at stabilization.
Rent comps 1 comps
| Address | Beds | Baths | Sqft | Rent | $/sqft | DOM | Units | Dist |
|---|---|---|---|---|---|---|---|---|
| 9210 Timberlane Dr Stanwood, MI | 3.0 | 2.0 | 1632 | $2,000 | $1.23 | 5d | 1 | 1.03mi |
HOA detail
- Monthly dues
- $75 · $900/yr
Listing history 31 events
-
2026-05-31days on market $249,900 Active 21 DOM
-
2026-05-31days on market $249,900 Active 20 DOM
-
2026-05-10$249,900 Active 971-char remark
-
2026-05-10$249,900 Active 980-char remark
-
2026-05-10$249,900 Active
-
2026-05-09historical $249,900
-
2026-05-09historical $249,900 980-char remark
-
2025-01-27historical
-
2025-01-27historical
-
2024-10-05$239,000 Active
-
2024-10-05$239,000 Active
-
2024-01-03historical
-
2024-01-03historical
-
2023-09-05price $225,000
-
2023-09-05price $225,000
-
2023-09-05price $225,000
-
2023-08-25$255,000 Active
-
2023-08-25$255,000 Active
-
2023-05-23soldstatus $225,900
-
2023-05-16soldstatus $225,900 Sold
-
2023-05-16soldstatus $225,900 Sold
-
2023-05-02status Pending
-
2023-05-02status Pending
-
2023-05-02status Pending
-
2023-04-21historical Accepting Backup Offers
-
2023-04-21historical Accepting Backup Offers
-
2023-04-21historical Active - Backup Offers Accepted
-
2023-04-18$219,900 Active
-
2023-04-18$219,900 Active
-
2023-04-18$219,900 Active
-
2014-10-09soldstatus $74,500
ⓘ Source: listings_history table (triggers on properties + properties_extension) + one-shot
backfill from property_details.listing_events for pre-trigger history.
Climate risk First Street
- Flood 1/10 Low FEMA zone X (unshaded) · 0% chance over 30 yrs
- Wildfire 3/10 Moderate
- Heat 1/10 Low 7 d/yr ≥95°F today · 14 d/yr by 30 yrs out
- Wind 1/10 Low
- Air quality 2/10 Low 0 unhealthy d/yr today · 1 by 30 yrs out
Nearby sold comps map
Loading sold comps map…
Walkable amenities ~0.75 mi
Loading nearby amenities…
Taxation est. · year 1
- Rental income
- $24,000
- − Mortgage interest
- −$13,998
- − Property taxes
- −$3,748
- − Insurance
- −$1,250
- − Repairs & maintenance
- −$1,920
- − Management
- −$1,920
- − HOA
- −$900
- − Depreciation
- −$7,270
- Taxable loss
- −$7,006
- Est. tax savings @ 24.0%
- +$1,681
- After-tax cash flow
- $-983/yr
For passive investors: Depreciation is non-cash, so a rental often shows a tax loss while cash-flowing — sheltering income. Rental losses are passive: they offset passive income freely, and up to $25,000/yr can offset ordinary (W-2) income if you actively participate and your MAGI is under $100k (phasing out to $0 by $150k); unused losses carry forward. On sale, claimed depreciation is recaptured at up to 25%, and gains may owe capital-gains tax (a 1031 exchange can defer both). Figures are a year-1 estimate at your 24.0% rate — not tax advice; consult a CPA.
Schools (NCES district)
- District
- Morley Stanwood Community Schools
- NCES district ID
- 2624600
- Math proficiency
- 24% ▼ -1.00%
- Reading proficiency
- 33% ▲ 1.00%
- Median HH income
- $40,617
- Composite
- 24.03/100
- National rank
- #7769
- State rank
- #390 of 540 in MI
Livability — Austin
No livability data for this city. (Only ~50 U.S. cities are tracked.)
Census & demographics
- Census place
- Canadian Lakes, MI
- Population (ZIP)
- 4,851
Population outlook (Mecosta County) Hauer SSP2
- Today (2025)
- 42,954 people
- By 2030
- 42,954 · +0.0%
- By 2040
- 41,574 · -3.2%
- By 2050
- 39,250 · -8.6%
- By 2075
- 32,628 · -24.0%
- By 2100
- 27,476 · -36.0%
Race, ethnicity, and origin ACS 2023
- Neighborhood character
- Predominantly White (96%)
- Race & ethnicity
- White 96% Two or more races 3% Hispanic / Latino 1%
- Common ancestry
- Iranian 8% Romanian 7% Lithuanian 4%
- Foreign-born
- 1% · Canada
- Languages at home
- 95% English-only · German/W. Germanic 3% Spanish 1%
Political lean MEDSL · Mecosta
- 2024 margin
- Solid R (+30.0) · D 34.2% · R 64.2% · Other 1.6%
- 2008→2024 swing
- -29.3pp toward R · 2008: -0.7pp · 2024: -30.0pp
- All cycles
- 2024: R+30.0 2020: R+28.0 2016: R+26.1 2012: R+9.8 2008: R+0.7
Not yet ingested
- Civics
- —
Market trends
- HPI YoY
- ▼ -73.43%
- Current HPI
- 196.1356
- Rent YoY
- —
- Metro
- —
- State GDP YoY
- ▲ 1.37%
- F500 in state
- 28
Industry mix (Fortune 500 HQ in MI)
| Industry | F500 HQs | Revenue |
|---|---|---|
| Automotive Parts | 3 | $48B |
|
||
| Automotive | 2 | $372B |
|
||
| Chemicals | 1 | $45B |
|
||
| Automotive Retail | 1 | $29B |
|
||
| Healthcare / Medical Devices | 1 | $23B |
|
||
| Automotive Technology | 1 | $20B |
|
||
Price history
+235.4% since first listed28 events — show timeline
- 2026-05-31 Listing Removed — MiRealSource-MiMLS
- 2026-05-10 Listed $249,900 REALCOMP
- 2026-05-10 Listed $249,900 MiRealSource-MiMLS
- 2026-05-09 Coming Soon — MiRealSource-MiMLS
- 2025-01-27 Listing Removed — REALCOMP
- 2025-01-27 Listing Removed — MiRealSource-MiMLS
- 2024-10-05 Listed $239,000 REALCOMP
- 2024-10-05 Listed $239,000 MiRealSource-MiMLS
- 2024-01-03 Listing Removed — MiRealSource-MiMLS
- 2024-01-03 Listing Removed — REALCOMP
- 2023-09-05 Price Changed $225,000 MiRealSource-MiMLS
- 2023-09-05 Price Changed $225,000 REALCOMP
- 2023-09-05 Price Changed $225,000 SW Michigan MLS
- 2023-08-25 Listed $255,000 MiRealSource-MiMLS
- 2023-08-25 Listed $255,000 REALCOMP
- 2023-05-23 Sold (Public Records) $225,900 Public Records
- 2023-05-16 Sold (MLS) $225,900 SW Michigan MLS
- 2023-05-16 Sold (MLS) $225,900 REALCOMP
- 2023-05-02 Pending — REALCOMP
- 2023-05-02 Pending — MiRealSource-MiMLS
- 2023-05-02 Pending — SW Michigan MLS
- 2023-04-21 Contingent — MiRealSource-MiMLS
- 2023-04-21 Contingent — REALCOMP
- 2023-04-21 Contingent — SW Michigan MLS
- 2023-04-18 Listed $219,900 MiRealSource-MiMLS
- 2023-04-18 Listed $219,900 SW Michigan MLS
- 2023-04-18 Listed $219,900 REALCOMP
- 2014-10-09 Sold (Public Records) $74,500 Public Records
Cash-flow waterfall
monthlySold comps — $/sqft
last 12 mo · ≤1 miLoading sold comps…