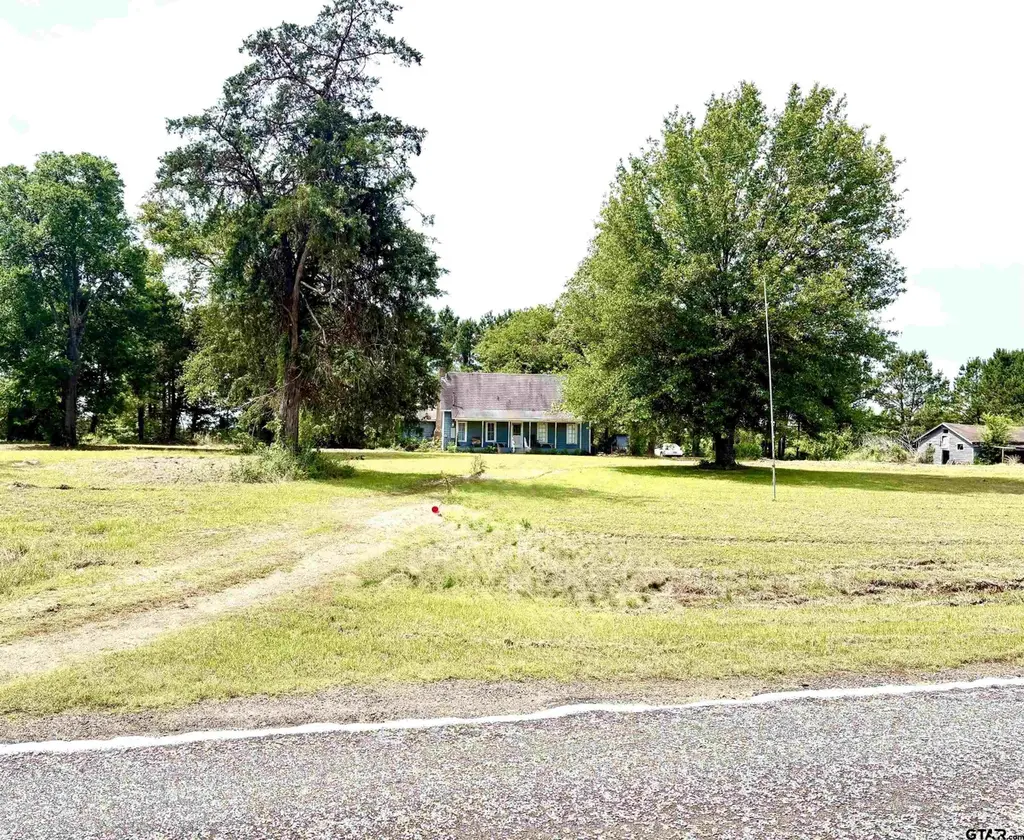
1708 Fm 1519
Rocky Mound, TX 75451
$129,000C
3 bd · 2.0 ba ·
1,668 sqft ·
Built 1938
· SingleFamily
· Active
· 19 DOM
Cashflow @ list (25.0% down · 7.5%)
Estimated rent
$1,250/mo
Mortgage (P&I)
−$676
Tax + insurance
−$215
HOA
−$0
Vac / Maint / Mgmt
−$262
Net cashflow
$96/mo
Annual
$1,150/yr
Cap rate
7.18%
Cash-on-cash
3.18%
DSCR
1.14
1% rule
0.97%
Cash to close
$36,120
Investor read
- This is a 3-bed/2.0-bath single-family listed at $129k. Condition is rated fair.
- At list price, monthly cash flow is $96 ($1k/yr) — positive.
- The deal already cash-flows at list — no discount required.
- To meet the 1% rule (rent ≥ 1% of price), the offer needs to be $125k (3.1% below list).
- It's been on market 19 days — a 2% lower offer ($127k) is reasonable based on typical stale-listing flexibility.
- Recommended offer: $125k (3.1% below list) — sets the bar for 1% rule.
- In year one you build about $1k of equity ($892 loan paydown + $398 appreciation (0.3% local appreciation)).
- Location reads 43/100 on livability (#1,576 in TX) — a working-class tenant base; expect higher turnover. Strengths: cost of living A+, crime A; Watch: amenities F, commute F, employment F.
- Pittsburg ISD (town): math 54% / reading 44% proficiency, ranked #216 of 826 in TX (top 26%) — families likely to look elsewhere, expect single-tenant / working-renter base with shorter leases; 68% free/reduced lunch — lower-income household profile, screen leases tightly.
- Zoned schools: Pittsburg El (math 34% / reading 35%, grade F, #1,995 of 4,322 statewide, top 50%, 545 students, 80% FRL); Pittsburg J H (math 48% / reading 43%, grade D+, #470 of 1,662 statewide, top 29%, 349 students, 82% FRL); Pittsburg H S (math 62% / reading 52%, grade C, #333 of 1,632 statewide, top 22%, 726 students, 78% FRL).
- Watch-outs: built in 1938 — expect roof / HVAC / electrical / plumbing capex.
- Market conditions: 39 active listings in the ZIP; 3 units permitted in Camp County in 2024 (0 in 5+ unit buildings).
- Camp County population projected at +13% by 2050 — modest demand growth; plan on rents tracking national, not racing it.
- At projected returns (0.3% appreciation + 3.0% rent growth), your $36k cash investment doubles in ~9 years — after that, you're playing with house money.
- Cap rate 7.2% vs local median 1.1% in Rocky Mound — top-decile yield for the area; either an underpriced asset or a hidden risk that comps aren't pricing in. Stress-test before assuming the spread holds.
Questions for listing agent
- Have any recent inspections been done? Can we get a copy of the seller's disclosures and any deferred-maintenance estimates?
- Built in 1938 — when were the roof, HVAC, electrical panel, plumbing, and water heater last replaced?
- Is there a deadline driving the sale (1031 exchange, divorce, estate, relocation)? That informs how much negotiation room exists.
- Schools are F-rated, which usually means shorter tenancies and higher turnover. Who's the typical renter profile here, and what's been the actual vacancy rate?
- What's the average days-on-market for RENTAL listings here right now (not sales)? A rising rental-DOM trend means longer vacancies and softer asking-rent achievability than the comps imply.
- What's the recent tenant-quality profile in this submarket — average credit score on applications, eviction rate, late-payment / NSF rate, and stable-employment percentage? A property-management company in the area should have these aggregated.
- How much new for-sale + rental construction is in the pipeline within 1–3 miles? Heavy new supply typically softens prices + rents 12–24 months out; constrained supply supports both.
Repairs flagged (vision-AI assessment)
- Major: roof — Severe weathering
- Major: exterior siding — Significant wear
- Major: paint — Peeling and chipping
- Major: flooring — Worn and damaged tiles
- Major: landscaping — Overgrown vegetation
- Major: fencing — Inadequate and possibly unsafe
CashFlowRE · CFR-3CB545483XPRQZ
· Data 2 weeks ago
cashflowre.app · 2026-05-29