1708 Fm 1519 · Rocky Mound, TX
Flood risk No data
- FEMA flood zone
- —
- Chance of flooding over 30 yrs
- —
- Est. flood insurance / yr
- —
Fire risk No data
- Est. fire insurance / yr
- —
Heat risk No data
- Hot days now (above threshold)
- —
- Hot days in 30 yrs
- —
Wind risk No data
- Chance of severe wind over 30 yrs
- —
Air-quality risk No data
- Unhealthy air days now
- —
- Unhealthy air days in 30 yrs
- —
Risk factors via First Street. Map © Google.
Why this score? — see what drove the C grade
The composite is a weighted blend of 9 inputs, each scored 0–100. Each bar is that input's sub-score; the figure is the points it added to the 100-point composite (weight × sub-score).
- Cash flow +17.4/30.0
- ARV discount +15.0/15.0
- DSCR +5.4/10.0
- Appreciation +5.2/10.0
- 1% rule +4.7/10.0
- Schools +4.1/10.0
- Rent growth +2.5/5.0
- Condition / age +2.2/5.0
- Livability +2.1/5.0
$129,000
🖨 Deal sheet 📄 Offer letter ✓ Due diligence
Listing remarks
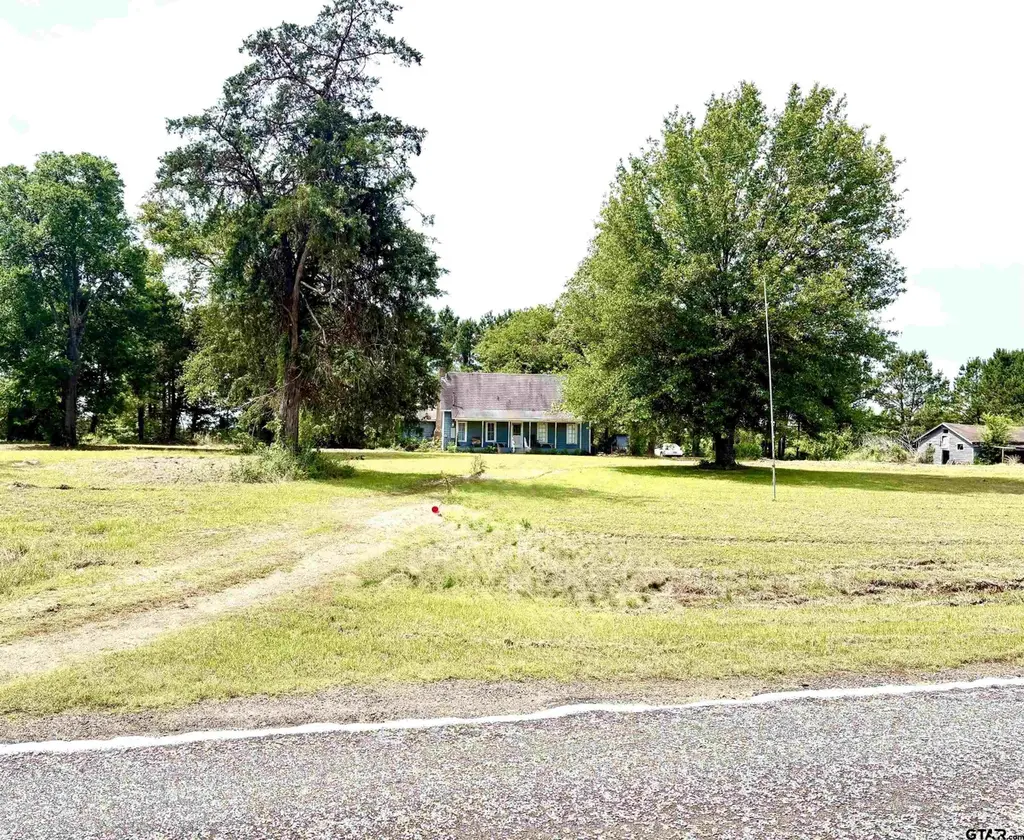
Nestled on 2.64 acres MOL along a Farm-to-Market road, this charming historic home offers privacy with the residence set back from the roadway among mature trees and open space. A barn consistent with the age and character of the home adds to the property’s timeless appeal. The acreage includes two peach trees, a pear tree, room for gardening, and a fenced area just off the back porch—ideal for small children or pets to safely enjoy the outdoors. An old well on the property has been professionally welded shut. Inside, the home features a unique dog run design with an added living area at the rear of the house. Painted white plank wood walls and ceilings throughout the dog run cr
Key facts
- Open space
- Two peach trees
- 2.64 acres mol
Tags
Property features AI
Exterior
- Home design: Single-family detached residence; Single-story
- Construction: Composition roof
- Exterior features: Front porch; On-site storage structure
Interior
- Kitchen: Dishwasher
- Bathrooms: Two full bathrooms
- Heating & cooling: Central heating; Electric heating; Wood stove; Central air conditioning; Ceiling fans
- Interior features: Vaulted ceilings; One wood-burning fireplace located in the master bedroom
Neighborhood map
What this means for you Summary
Snapshot
- This is a 3-bed/2.0-bath single-family listed at $129k. Condition is rated fair.
Deal economics
- At list price, monthly cash flow is $96 ($1k/yr) — positive.
- The deal already cash-flows at list — no discount required.
- To meet the 1% rule (rent ≥ 1% of price), the offer needs to be $125k (3.1% below list).
- Recommended offer: $125k (3.1% below list) — sets the bar for 1% rule.
- Cap rate 7.2% vs local median 1.1% in Rocky Mound — top-decile yield for the area; either an underpriced asset or a hidden risk that comps aren't pricing in. Stress-test before assuming the spread holds.
Location & tenants
- Location reads 43/100 on livability (#1,576 in TX) — a working-class tenant base; expect higher turnover. Strengths: cost of living A+, crime A; Watch: amenities F, commute F, employment F.
- Pittsburg ISD (town): math 54% / reading 44% proficiency, ranked #216 of 826 in TX (top 26%) — families likely to look elsewhere, expect single-tenant / working-renter base with shorter leases; 68% free/reduced lunch — lower-income household profile, screen leases tightly.
- Zoned schools: Pittsburg El (math 34% / reading 35%, grade F, #1,995 of 4,322 statewide, top 50%, 545 students, 80% FRL); Pittsburg J H (math 48% / reading 43%, grade D+, #470 of 1,662 statewide, top 29%, 349 students, 82% FRL); Pittsburg H S (math 62% / reading 52%, grade C, #333 of 1,632 statewide, top 22%, 726 students, 78% FRL).
- Market conditions: 39 active listings in the ZIP; 3 units permitted in Camp County in 2024 (0 in 5+ unit buildings).
Forward outlook
- In year one you build about $1k of equity ($892 loan paydown + $398 appreciation (0.3% local appreciation)).
- Camp County population projected at +13% by 2050 — modest demand growth; plan on rents tracking national, not racing it.
- At projected returns (0.3% appreciation + 3.0% rent growth), your $36k cash investment doubles in ~9 years — after that, you're playing with house money.
Negotiation context
- It's been on market 19 days — a 2% lower offer ($127k) is reasonable based on typical stale-listing flexibility.
Risks & watch-outs
- Watch-outs: built in 1938 — expect roof / HVAC / electrical / plumbing capex.
Questions for the listing agent
- Have any recent inspections been done? Can we get a copy of the seller's disclosures and any deferred-maintenance estimates?
- Built in 1938 — when were the roof, HVAC, electrical panel, plumbing, and water heater last replaced?
- Is there a deadline driving the sale (1031 exchange, divorce, estate, relocation)? That informs how much negotiation room exists.
- Schools are F-rated, which usually means shorter tenancies and higher turnover. Who's the typical renter profile here, and what's been the actual vacancy rate?
- What's the average days-on-market for RENTAL listings here right now (not sales)? A rising rental-DOM trend means longer vacancies and softer asking-rent achievability than the comps imply.
- What's the recent tenant-quality profile in this submarket — average credit score on applications, eviction rate, late-payment / NSF rate, and stable-employment percentage? A property-management company in the area should have these aggregated.
- How much new for-sale + rental construction is in the pipeline within 1–3 miles? Heavy new supply typically softens prices + rents 12–24 months out; constrained supply supports both.
Investment metrics
- 1% rule
- 0.97% ✗
- Cap rate
- 7.18%
- Cash-on-cash
- 3.18%
- DSCR
- 1.14
- GRM
- 8.6
CMA / ARV
- ARV (median comp)
- $232,445
- List price
- $129,000
- Delta
- -44.50%
- Verdict
- UNDERPRICED
- Comps
- 4 within 2.0 mi
Projected returns pro-forma
0.31% appreciation · 3.0% rent growth · sell at horizon
- IRR
- 2.4%
- Equity multiple
- 1.12×
- Total profit
- $4,233
- Equity at exit
- $39,461
- IRR
- 7.6%
- Equity multiple
- 1.85×
- Total profit
- $30,702
- Equity at exit
- $49,064
Cash invested: $36,120 (down + closing). Projections, not guarantees.
Landlord ↔ Tenant lean methodology
- Overall (STATE)
- 87 Strongly Landlord-Friendly
- State Texas
- 87 Strongly Landlord-Friendly · R+5
- County
- — inherits STATE
- City
- — inherits STATE
ZIP-level market 75451
- Home prices YoY
- 0.3%
- Active inventory
- 39
- Price-to-rent
- 8.6×
Monthly cashflow live
- Estimated rent
- $1,250 medium interval (Pro) →
- Mortgage (P&I)
- −$676
- Tax est. 1.5%
- −$161 /mo · $1,935/yr
- Insurance
- −$54
- HOA
- −$0
- Vacancy / Maint / Mgmt
- −$262
- Net cashflow
- $96
Break-even live
UW: 25.0% down · 7.5% · 30yr · 1.5% tax · 5.0% vac · 8.0% maint · 8.0% mgmt
Financing live
Cash to close
- Down payment
- $32,250
- Closing costs
- $3,870
- Reserves months
- —
- Total cash needed
- —
Loan-product check · same deal, 3 products live
Conventional
25% down · 7.5% · 30yr
- Down + closing
- —
- Monthly P&I
- —
- Monthly cashflow
- —
- DSCR
- —
- Eligible?
- —
Personal DTI + credit; lowest rate.
DSCR
20% down · 8.5% · 30yr
- Down + closing
- —
- Monthly P&I
- —
- Monthly cashflow
- —
- DSCR
- —
- Eligible?
- —
No personal income docs; deal must DSCR.
Hard money
10% down · 12.0% · 12mo
- Down + closing
- —
- Monthly P&I
- —
- Monthly cashflow
- —
- DSCR
- —
- Eligible?
- —
Short-term bridge; refi at stabilization.
Listing history 6 events
-
2026-06-03days on market $129,000 Active 19 DOM
-
2026-06-02days on market $129,000 Active 18 DOM
-
2026-06-01days on market $129,000 Active 17 DOM
-
2026-05-31days on market $129,000 Active 16 DOM
-
2026-05-30days on market $129,000 Active 15 DOM
-
2026-05-15$129,000 Active 1474-char remark
ⓘ Source: listings_history table (triggers on properties + properties_extension) + one-shot
backfill from property_details.listing_events for pre-trigger history.
Nearby sold comps map
Loading sold comps map…
Walkable amenities ~0.75 mi
Loading nearby amenities…
Taxation est. · year 1
- Rental income
- $14,997
- − Mortgage interest
- −$7,226
- − Property taxes
- −$1,935
- − Insurance
- −$645
- − Repairs & maintenance
- −$1,200
- − Management
- −$1,200
- − Depreciation
- −$3,753
- Taxable loss
- −$961
- Est. tax savings @ 24.0%
- +$231
- After-tax cash flow
- $1,381/yr
For passive investors: Depreciation is non-cash, so a rental often shows a tax loss while cash-flowing — sheltering income. Rental losses are passive: they offset passive income freely, and up to $25,000/yr can offset ordinary (W-2) income if you actively participate and your MAGI is under $100k (phasing out to $0 by $150k); unused losses carry forward. On sale, claimed depreciation is recaptured at up to 25%, and gains may owe capital-gains tax (a 1031 exchange can defer both). Figures are a year-1 estimate at your 24.0% rate — not tax advice; consult a CPA.
Condition & rehab AI · 13 photos
This property requires significant repairs and maintenance, including a new roof, exterior siding, and painting, to improve its condition and value.
Repairs flagged
- Major roof — Severe weathering
- Major exterior siding — Significant wear
- Major paint — Peeling and chipping
- Major flooring — Worn and damaged tiles
- Major landscaping — Overgrown vegetation
- Major fencing — Inadequate and possibly unsafe
Value-add opportunities
- Both New roof — Improves both resale and rental value
- Both New exterior siding — Enhances curb appeal and value
- Both Painting — Fresh paint improves aesthetics and value
- Both New flooring — Fresh, durable flooring enhances living space
- Both Landscaping — Well-maintained landscaping improves curb appeal and value
- Both New fencing — Safe and attractive fencing enhances property value
Renovation cost estimate screening
| Repair item | Severity | Est. cost |
|---|---|---|
| roof · Severe weathering | Major | $15,000–50,000 |
| exterior siding · Significant wear | Major | $15,000–50,000 |
| paint · Peeling and chipping | Major | $15,000–50,000 |
| flooring · Worn and damaged tiles | Major | $15,000–50,000 |
| landscaping · Overgrown vegetation | Major | $15,000–50,000 |
| fencing · Inadequate and possibly unsafe | Major | $15,000–50,000 |
| Total estimated repair cost · 6 items | $90,000–300,000 |
Value-add ROI direction
- Both New roof — Improves both resale and rental value ↑
- Both New exterior siding — Enhances curb appeal and value ↑
- Both Painting — Fresh paint improves aesthetics and value ↑
- Both New flooring — Fresh, durable flooring enhances living space ↑
- Both Landscaping — Well-maintained landscaping improves curb appeal and value ↑
- Both New fencing — Safe and attractive fencing enhances property value ↑
ⓘ Cost ranges are severity-bucket heuristics (US national rule-of-thumb). Get contractor quotes + a written scope before underwriting a rehab budget.
Schools (NCES district)
- District
- Pittsburg ISD
- NCES district ID
- 4835010
- Math proficiency
- 54% ▼ -16.00%
- Reading proficiency
- 44% ▼ -16.00%
- Median HH income
- $38,136
- Composite
- 40.87/100
- National rank
- #3627
- State rank
- #216 of 826 in TX
Livability — Rocky Mound
- Score
- 43/100
- State rank
- #1576
- US rank
- #26922
Category grades
Schools grade is shown separately in the Schools card above.
Census & demographics
- Population (ZIP)
- 1,496
Population outlook (Camp County) Hauer SSP2
- Today (2025)
- 13,403 people
- By 2030
- 13,741 · +2.5%
- By 2040
- 14,436 · +7.7%
- By 2050
- 15,135 · +12.9%
- By 2075
- 16,836 · +25.6%
- By 2100
- 17,582 · +31.2%
Race, ethnicity, and origin ACS 2023
- Neighborhood character
- Predominantly White (82%)
- Race & ethnicity
- White 82% Hispanic / Latino 7% Two or more races 7% Black 6%
- Hispanic origin (detail)
- Mexican 7%
- Common ancestry
- Serbian 5% Italian 4% Lithuanian 1%
- Foreign-born
- 3% · Canada
- Languages at home
- 98% English-only · French/Haitian/Cajun 1% Spanish 1%
Political lean MEDSL · Camp
- 2024 margin
- Solid R (+53.6) · D 22.9% · R 76.5%
- 2008→2024 swing
- -30.3pp toward R · 2008: -23.3pp · 2024: -53.6pp
- All cycles
- 2024: R+53.6 2020: R+44.1 2016: R+42.7 2012: R+33.5 2008: R+23.3
Not yet ingested
- Civics
- —
Market trends
- HPI YoY
- ▲ 0.31%
- Current HPI
- 90.6386
- Rent YoY
- —
- Metro
- —
- State GDP YoY
- ▲ 3.95%
- F500 in state
- 110
Industry mix (Fortune 500 HQ in TX)
| Industry | F500 HQs | Revenue |
|---|---|---|
| Energy | 16 | $1,198B |
|
||
| Technology | 5 | $198B |
|
||
| Engineering / Construction | 4 | $72B |
|
||
| Energy Services | 3 | $60B |
|
||
| Utilities | 3 | $41B |
|
||
| Healthcare | 2 | $330B |
|
||
Cash-flow waterfall
monthlySold comps — $/sqft
last 12 mo · ≤1 miLoading sold comps…