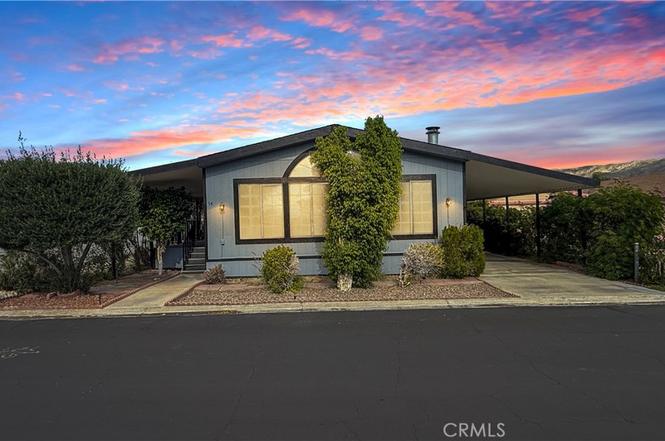
15300 Palm
Desert Hot Springs, CA 92240
$209,900C
2 bd · 2.0 ba ·
1,435 sqft ·
Built 1989
· Manufactured
· Active
· 3 DOM
Cashflow @ list (25.0% down · 7.5%)
Estimated rent
$2,528/mo
Mortgage (P&I)
−$1,101
Tax + insurance
−$282
HOA
−$300
Vac / Maint / Mgmt
−$531
Net cashflow
$315/mo
Annual
$3,775/yr
Cap rate
8.09%
Cash-on-cash
6.42%
DSCR
1.29
1% rule
1.20%
Cash to close
$58,772
Investor read
- This is a 2-bed/2.0-bath manufactured listed at $210k.
- At list price, monthly cash flow is $315 ($4k/yr) — positive.
- The deal already cash-flows at list — no discount required.
- Meets the 1% rule at list price ($3k rent vs $210k).
- Only 3 days on market — expect competitive offers; lowballing is unlikely to land.
- Local home prices are declining (-3.0%/yr); year-one equity from $1k of loan paydown is wiped out by about $6k of value loss. Plan a longer hold.
- Location reads 49/100 on livability (#1,149 in CA) — a working-class tenant base; expect higher turnover. Strengths: housing B+; Watch: crime D+, schools F, amenities F.
- Palm Springs Unified (suburban): math 21% / reading 42% proficiency, ranked #328 of 517 in CA (top 63%) — families likely to look elsewhere, expect single-tenant / working-renter base with shorter leases; 73% free/reduced lunch — lower-income household profile, screen leases tightly.
- Market conditions: Rents rising (+3.7%/yr); 515 active listings in the ZIP; 9 comparable units currently listed for rent nearby; rentals at typical pace (median 25d on market — plan ~3-4 weeks tenant-placement turnaround); 44% of comp listings sitting > 30 days — soft ceiling on asking rent; 9,195 units permitted in Riverside County in 2024 (1,512 in 5+ unit buildings).
- Riverside County population projected at +22% by 2050 — long-run rental-demand tailwind backs the buy-and-hold thesis.
- 9 sale attempts since 15y ago with the ask held roughly flat each time — persistent listings suggest the price (not the market) is what's stuck; bring a comps-based counter.
- Climate carrying-cost: major wildfire risk; extreme-heat days projected 7→20/yr by 2055 (HVAC capex compounding) — expect insurance premiums to compound above CPI over the hold.
- Cap rate 8.1% vs local median 4.0% in Desert Hot Springs — top-decile yield for the area; either an underpriced asset or a hidden risk that comps aren't pricing in. Stress-test before assuming the spread holds.
- At $2,528/mo this rent would consume 56% of the median local household income ($54k/yr) (locally 2095% of renters already pay >50% of income on rent) — very limited rent-growth headroom before tenants either downsize or default.
Questions for listing agent
- What does the HOA fee cover, when was the last increase, and are there any pending special assessments or reserve-fund shortfalls?
- Is there a deadline driving the sale (1031 exchange, divorce, estate, relocation)? That informs how much negotiation room exists.
- Schools are F-rated, which usually means shorter tenancies and higher turnover. Who's the typical renter profile here, and what's been the actual vacancy rate?
- Crime grade is D in this area — have there been break-ins, vandalism, or insurance claims at this property in the last 3 years? What carrier currently insures it and at what premium?
- What's the average days-on-market for RENTAL listings here right now (not sales)? A rising rental-DOM trend means longer vacancies and softer asking-rent achievability than the comps imply.
- What's the recent tenant-quality profile in this submarket — average credit score on applications, eviction rate, late-payment / NSF rate, and stable-employment percentage? A property-management company in the area should have these aggregated.
- How much new for-sale + rental construction is in the pipeline within 1–3 miles? Heavy new supply typically softens prices + rents 12–24 months out; constrained supply supports both.
CashFlowRE · CFR-3DBTQGF0TE2X2G
· Data 2 days ago
cashflowre.app · 2026-05-29