15300 Palm · Desert Hot Springs, CA
Flood risk 1/10 · Minimal
- FEMA flood zone
- X (shaded)
- Chance of flooding over 30 yrs
- 0.0%
- Est. flood insurance / yr
- $507 – $1,088
Fire risk 6/10 · Moderate
- Est. fire insurance / yr
- $659 – $1,223
Heat risk 9/10 · Severe
- Hot days now (above 111°F)
- 7 days/yr
- Hot days in 30 yrs
- 20 days/yr
Wind risk 1/10 · Minimal
- Chance of severe wind over 30 yrs
- —
Air-quality risk 5/10 · Moderate
- Unhealthy air days now
- 8 days/yr
- Unhealthy air days in 30 yrs
- 11 days/yr
Risk factors via First Street. Map © Google.
Why this score? — see what drove the C grade
The composite is a weighted blend of 9 inputs, each scored 0–100. Each bar is that input's sub-score; the figure is the points it added to the 100-point composite (weight × sub-score).
- Cash flow +21.5/30.0
- ARV discount +11.4/15.0
- 1% rule +7.0/10.0
- DSCR +6.9/10.0
- Rent growth +3.4/5.0
- Schools +2.7/10.0
- Livability +2.5/5.0
- Condition / age +2.5/5.0
- Appreciation +0.0/10.0
$209,900
🖨 Deal sheet 📄 Offer letter ✓ Due diligence
Listing remarks MLS
FANTASTIC PRICE!! MOST SOUGHT AFTER MODEL, SPACE # 183. LOCATED IN VISTA MONTANA, AN EXCLUSIVE 55+ COMMUNITY. HOME SITS ON FEE LAND (YOU OWN THE LAND) AND FEATURES FRESH EXTERIOR PAINT, LIVING ROOM WITH VAULTED CEILINGS, LARGE MASTER BEDROOM WITH ENSUITE, COPPER PLUMBING, TWO COOLING SYSTEMS, LARGE YARD, SPRINKLER & ALARM SYSTEMS AND COZY FIREPLACE. APPLIANCES INCLUDED!
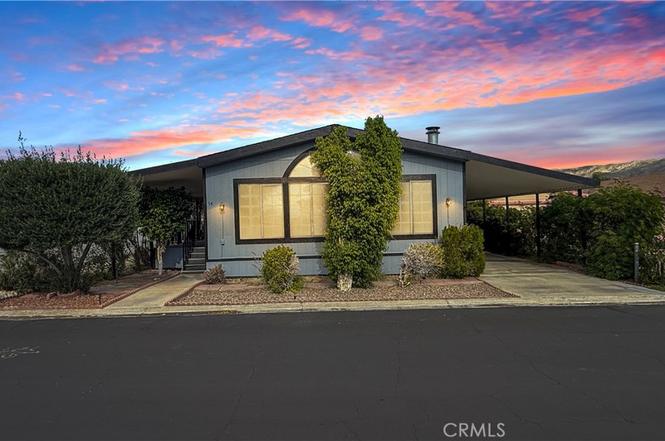
Key facts
- Arched front window
- Open-concept living
- Mountain views
Tags
Property features AI
Finance
- Other: Planned development common interest; No shared/common walls; Community features: street lighting, sidewalks, suburban setting
- Financial info: Property subject to special assessments
- HOA & community: Part of Vista Montana homeowners association; Monthly HOA fee of $300; Senior community; Community amenities: pool, spa, clubhouse, banquet facilities, billiard room, card room, multipurpose/recreational room, barbecue areas, onsite property management, guard, controlled access, cable TV (per association rules), pet rules
Exterior
- Parking: Attached carport
- Security: Gated community with controlled access and guard (community amenities include security and controlled access)
- Utilities: Public sewer; District/public water
- Home design: Manufactured House; Single-story (1 story); Entry at ground level with stairs; Located in planned development community (Vista Montana)
- Construction: No ADU; Year built source: assessor
- Exterior features: Manufactured home; Paved lot with rectangular shape; Association-maintained in-ground community pool
Interior
- Kitchen: No kitchen appliance details provided
- Bedrooms: 2 main level bedrooms
- Flooring: Laminate flooring
- Bathrooms: 2 full bathrooms
- Heating & cooling: Central heating (central furnace); Central air conditioning
- Interior features: One-level home with ground entry and steps; Primary bedroom on main level; All bedrooms located on the ground floor; Living room fireplace
- Laundry & utility: Indoor laundry room; Washer hookup; Gas dryer hookup; Individual laundry room
Neighborhood map
What this means for you Summary
Snapshot
- This is a 2-bed/2.0-bath manufactured listed at $210k.
Deal economics
- At list price, monthly cash flow is $315 ($4k/yr) — positive.
- The deal already cash-flows at list — no discount required.
- Meets the 1% rule at list price ($3k rent vs $210k).
- Cap rate 8.1% vs local median 4.0% in Desert Hot Springs — top-decile yield for the area; either an underpriced asset or a hidden risk that comps aren't pricing in. Stress-test before assuming the spread holds.
Location & tenants
- Location reads 49/100 on livability (#1,149 in CA) — a working-class tenant base; expect higher turnover. Strengths: housing B+; Watch: crime D+, schools F, amenities F.
- Palm Springs Unified (suburban): math 21% / reading 42% proficiency, ranked #328 of 517 in CA (top 63%) — families likely to look elsewhere, expect single-tenant / working-renter base with shorter leases; 73% free/reduced lunch — lower-income household profile, screen leases tightly.
- Market conditions: Rents rising (+3.7%/yr); 515 active listings in the ZIP; 9 comparable units currently listed for rent nearby; rentals at typical pace (median 24d on market — plan ~3-4 weeks tenant-placement turnaround); 44% of comp listings sitting > 30 days — soft ceiling on asking rent; 9,195 units permitted in Riverside County in 2024 (1,512 in 5+ unit buildings).
- At $2,528/mo this rent would consume 56% of the median local household income ($54k/yr) (locally 2095% of renters already pay >50% of income on rent) — very limited rent-growth headroom before tenants either downsize or default.
Forward outlook
- Local home prices are declining (-3.0%/yr); year-one equity from $1k of loan paydown is wiped out by about $6k of value loss. Plan a longer hold.
- Riverside County population projected at +22% by 2050 — long-run rental-demand tailwind backs the buy-and-hold thesis.
Negotiation context
- Only 3 days on market — expect competitive offers; lowballing is unlikely to land.
- 9 sale attempts since 15y ago with the ask held roughly flat each time — persistent listings suggest the price (not the market) is what's stuck; bring a comps-based counter.
Risks & watch-outs
- Climate carrying-cost: major wildfire risk; extreme-heat days projected 7→20/yr by 2055 (HVAC capex compounding) — expect insurance premiums to compound above CPI over the hold.
Questions for the listing agent
- What does the HOA fee cover, when was the last increase, and are there any pending special assessments or reserve-fund shortfalls?
- Is there a deadline driving the sale (1031 exchange, divorce, estate, relocation)? That informs how much negotiation room exists.
- Schools are F-rated, which usually means shorter tenancies and higher turnover. Who's the typical renter profile here, and what's been the actual vacancy rate?
- Crime grade is D in this area — have there been break-ins, vandalism, or insurance claims at this property in the last 3 years? What carrier currently insures it and at what premium?
- What's the average days-on-market for RENTAL listings here right now (not sales)? A rising rental-DOM trend means longer vacancies and softer asking-rent achievability than the comps imply.
- What's the recent tenant-quality profile in this submarket — average credit score on applications, eviction rate, late-payment / NSF rate, and stable-employment percentage? A property-management company in the area should have these aggregated.
- How much new for-sale + rental construction is in the pipeline within 1–3 miles? Heavy new supply typically softens prices + rents 12–24 months out; constrained supply supports both.
Investment metrics
- 1% rule
- 1.20% ✓
- Cap rate
- 8.09%
- Cash-on-cash
- 6.42%
- DSCR
- 1.29
- GRM
- 6.9
CMA / ARV
- ARV (on-the-fly)
- $229,600
- Comps found
- 12
Show comp detail 12 sales within ~0.75 mi
| Address | Dist | Beds/Ba | Sqft | Sold | Price | $/sf | Match |
|---|---|---|---|---|---|---|---|
| 15300 Palm Dr #35 | 0.09mi | 2/2.0 | 1,430 (-0%) | 5mo | $105,000 | $73 | 91 |
| 15300 Palm Dr #161 | 0.05mi | 2/2.0 | 1,333 (-7%) | 1mo | $233,000 | $175 | 85 |
| 15300 Palm Dr #138 | 0.05mi | 2/2.0 | 1,323 (-8%) | 3mo | $237,000 | $179 | 82 |
| 15300 Palm Dr #209 | 0.14mi | 2/2.0 | 1,335 (-7%) | 3mo | $161,000 | $121 | 79 |
| 15300 Palm Dr #119 | 0.07mi | 3/2.0 (+1) | 1,344 (-6%) | 4mo | $220,000 | $164 | 78 |
| 15300 Palm Dr #255 | 0.13mi | 3/2.0 (+1) | 1,345 (-6%) | 2mo | $203,500 | $151 | 77 |
| 15300 Palm Dr #146 | 0.06mi | 3/2.0 (+1) | 1,539 (+7%) | 5mo | $218,000 | $142 | 76 |
| 15300 Palm Dr #22 | 0.06mi | 2/2.0 | 1,272 (-11%) | 5mo | $219,000 | $172 | 74 |
| 15300 Palm Dr #242 | 0.21mi | 2/2.0 | 1,552 (+8%) | 3mo | $212,750 | $137 | 74 |
| 14777 Palm Dr #186 | 0.56mi | 3/2.0 (+1) | 1,440 (+0%) | 2mo | $245,000 | $170 | 66 |
| 15300 Palm Dr #30 | 0.16mi | 3/2.0 (+1) | 1,248 (-13%) | 3mo | $200,000 | $160 | 63 |
| 14777 Palm Dr #15 | 0.54mi | 2/2.0 | 1,260 (-12%) | 3mo | $180,000 | $143 | 52 |
Match score weights: distance 35% · size 25% · config 20% · recency 20%. Top-matched comps best support the ARV.
Projected returns pro-forma
-3.0% appreciation · 3.66% rent growth · sell at horizon
- IRR
- -5.5%
- Equity multiple
- 0.79×
- Total profit
- $-12,105
- Equity at exit
- $31,297
- IRR
- 5.1%
- Equity multiple
- 1.39×
- Total profit
- $23,023
- Equity at exit
- $18,148
Cash invested: $58,772 (down + closing). Projections, not guarantees.
Landlord ↔ Tenant lean methodology
- Overall (STATE)
- 18 Strongly Tenant-Friendly
- State California
- 18 Strongly Tenant-Friendly · D+13
- County
- — inherits STATE
- City
- — inherits STATE
ZIP-level market 92240
- Home prices YoY
- -19.6%
- Rents YoY
- 3.7%
- Active inventory
- 515
- Price-to-rent
- 6.9×
Monthly cashflow live
- Estimated rent
- $2,528 high interval (Pro) →
- Mortgage (P&I)
- −$1,101
- Tax from tax record
- −$194 /mo · $2,333/yr
- Insurance
- −$87
- HOA
- −$300
- Vacancy / Maint / Mgmt
- −$531
- Net cashflow
- $315
Break-even live
UW: 25.0% down · 7.5% · 30yr · 1.5% tax · 5.0% vac · 8.0% maint · 8.0% mgmt
Financing live
Cash to close
- Down payment
- $52,475
- Closing costs
- $6,297
- Reserves months
- —
- Total cash needed
- —
Loan-product check · same deal, 3 products live
Conventional
25% down · 7.5% · 30yr
- Down + closing
- —
- Monthly P&I
- —
- Monthly cashflow
- —
- DSCR
- —
- Eligible?
- —
Personal DTI + credit; lowest rate.
DSCR
20% down · 8.5% · 30yr
- Down + closing
- —
- Monthly P&I
- —
- Monthly cashflow
- —
- DSCR
- —
- Eligible?
- —
No personal income docs; deal must DSCR.
Hard money
10% down · 12.0% · 12mo
- Down + closing
- —
- Monthly P&I
- —
- Monthly cashflow
- —
- DSCR
- —
- Eligible?
- —
Short-term bridge; refi at stabilization.
Rent comps 9 comps
| Address | Beds | Baths | Sqft | Rent | $/sqft | DOM | Units | Dist |
|---|---|---|---|---|---|---|---|---|
| 15300 Palm Dr Desert Hot Springs, CA | 3.0 | 2.0 | 1458 | $2,800 | $1.92 | 43d | 1 | 0.03mi |
| 15490 Avenida Rambla Desert Hot Springs, CA | 3.0 | 2.0 | 1088 | $2,600 | $2.39 | 43d | 1 | 0.80mi |
| 15490 Avenue Rambla Unit NA Desert Hot Springs, CA | 3.0 | 2.0 | 1088 | $2,600 | $2.39 | 24d | 1 | 0.80mi |
| 13987 El Cajon Dr Desert Hot Springs, CA | 3.0 | 2.0 | 1215 | $2,600 | $2.14 | 7d | 1 | 0.83mi |
| 16087 Bubbling Wells Rd Desert Hot Springs, CA | 3.0 | 2.0 | 1850 | $5,000 | $2.70 | 43d | 1 | 0.86mi |
| 13950 West Dr Unit B Desert Hot Springs, CA | 2.0 | 2.0 | 1008 | $1,600 | $1.59 | 1d | 1 | 0.99mi |
| 13715 El Rio Ln Desert Hot Springs, CA | 3.0 | 2.0 | 1318 | $2,600 | $1.97 | 7d | 1 | 1.23mi |
| 13322 El Rio Ln Desert Hot Springs, CA | 3.0 | 2.0 | 1215 | $2,750 | $2.26 | 43d | 1 | 1.35mi |
| 66824 Estrella Ave Desert Hot Springs, CA | 3.0 | 1.0 | 1700 | $2,300 | $1.35 | 23d | 1 | 1.47mi |
HOA detail
- Monthly dues
- $300 · $3,600/yr
Listing history 4 events
-
2026-06-18days on market $209,900 Active 3 DOM
-
2026-06-17days on market $209,900 Active 2 DOM
-
2026-06-15remarks 699-char remark
-
2026-06-15$209,900 Active 1 DOM
ⓘ Source: listings_history table (triggers on properties + properties_extension) + one-shot
backfill from property_details.listing_events for pre-trigger history.
Tax reassessment forecast CA · Resets to sale price
- Current annual tax
- $2,333 · $194/mo
- Projected year-2 tax
- $2,333 · $194/mo
- Expected delta
- $0/yr ($0/mo · 0.0%)
ⓘ Screening estimate from a state-policy table — verify with the county assessor before closing.
Climate risk First Street
- Flood 1/10 Low FEMA zone X (shaded) · 0% chance over 30 yrs
- Wildfire 6/10 Major
- Heat 9/10 Extreme 7 d/yr ≥111°F today · 20 d/yr by 30 yrs out
- Wind 1/10 Low
- Air quality 5/10 Major 8 unhealthy d/yr today · 11 by 30 yrs out
Nearby sold comps map
Loading sold comps map…
Walkable amenities ~0.75 mi
Loading nearby amenities…
Taxation est. · year 1
- Rental income
- $30,338
- − Mortgage interest
- −$11,758
- − Property taxes
- −$2,333
- − Insurance
- −$1,050
- − Repairs & maintenance
- −$2,427
- − Management
- −$2,427
- − HOA
- −$3,600
- − Depreciation
- −$6,106
- Taxable income
- $637
- Est. tax owed @ 24.0%
- −$153
- After-tax cash flow
- $3,622/yr
For passive investors: Depreciation is non-cash, so a rental often shows a tax loss while cash-flowing — sheltering income. Rental losses are passive: they offset passive income freely, and up to $25,000/yr can offset ordinary (W-2) income if you actively participate and your MAGI is under $100k (phasing out to $0 by $150k); unused losses carry forward. On sale, claimed depreciation is recaptured at up to 25%, and gains may owe capital-gains tax (a 1031 exchange can defer both). Figures are a year-1 estimate at your 24.0% rate — not tax advice; consult a CPA.
Schools (NCES district)
- District
- Palm Springs Unified
- NCES district ID
- 0629550
- Math proficiency
- 21% ▼ -7.00%
- Reading proficiency
- 42% ▬ 0.00%
- Median HH income
- $43,638
- Composite
- 26.76/100
- National rank
- #7131
- State rank
- #328 of 517 in CA
Livability — Desert Hot Springs
- Score
- 49/100
- State rank
- #1149
- US rank
- #25774
Category grades
Schools grade is shown separately in the Schools card above.
Census & demographics
- Census place
- Desert Hot Springs, CA
- County
- Riverside County · 2,287,001 people
- City population
- 41,615
- Metro
- Riverside-San Bernardino-Ontario, CA
- Population (ZIP)
- 41,615
- Household income
- $54,023
- Rent vs Own
- Severe rent burden
- 2095.0
Population outlook (Riverside County) Hauer SSP2
- Today (2025)
- 2,664,475 people
- By 2030
- 2,802,692 · +5.2%
- By 2040
- 3,050,904 · +14.5%
- By 2050
- 3,256,783 · +22.2%
- By 2075
- 3,655,058 · +37.2%
- By 2100
- 3,766,594 · +41.4%
Race, ethnicity, and origin ACS 2023
- Neighborhood character
- Majority Hispanic (64%)
- Race & ethnicity
- Hispanic / Latino 64% Two or more races 27% White 23% Black 7% Native American 2% Asian 2%
- Hispanic origin (detail)
- Mexican 53%
- Common ancestry
- Lithuanian 1% Romanian 1% Italian 1%
- Foreign-born
- 27% · Canada, Vietnam
- Languages at home
- 47% English-only · Spanish 50% Russian/Polish/Slavic 1%
Political lean MEDSL · Riverside
- 2024 margin
- Toss-up / Even · D 48.0% · R 49.3% · Other 2.6%
- 2008→2024 swing
- -3.6pp toward R · 2008: 2.3pp · 2024: -1.3pp
- All cycles
- 2024: R+1.3 2020: D+8.0 2016: D+4.3 2012: R+0.4 2008: D+2.3
Not yet ingested
- Civics
- —
Market trends
- HPI YoY
- ▼ -102.10%
- Current HPI
- 418.4691
- Rent YoY
- ▲ 3.66%
- Metro
- Riverside-San Bernardino-Ontario, CA
- State GDP YoY
- ▲ 3.21%
- F500 in state
- 116
Industry mix (Fortune 500 HQ in CA)
| Industry | F500 HQs | Revenue |
|---|---|---|
| Technology | 27 | $1,492B |
|
||
| Financial Services | 3 | $174B |
|
||
| Retail | 3 | $44B |
|
||
| Insurance | 3 | $26B |
|
||
| Media / Entertainment | 2 | $115B |
|
||
| Pharmaceuticals / Biotech | 2 | $62B |
|
||
Price history
+122.3% since first listed28 events — show timeline
- 2026-06-14 Listed $209,900 CRMLS
- 2026-05-25 Rental Removed $2,800 SHOWMOJO
- 2026-03-14 Listed for Rent $2,800 SHOWMOJO
- 2026-01-27 Listing Removed — CRMLS
- 2026-01-12 Listed $210,000 CRMLS
- 2026-01-01 Rental Removed $2,800 SHOWMOJO
- 2025-11-26 Listed for Rent $2,800 SHOWMOJO
- 2025-09-13 Rental Removed $1,745 APPFOLIO
- 2025-07-06 Listed for Rent $1,745 APPFOLIO
- 2025-07-05 Rental Removed $1,745 APPFOLIO
- 2025-06-19 Price Changed $1,745 APPFOLIO
- 2025-05-17 Price Changed $1,795 APPFOLIO
- 2025-05-11 Price Changed $1,995 APPFOLIO
- 2025-04-30 Sold (MLS) $197,000 CRMLS
- 2025-04-23 Listed for Rent $2,100 APPFOLIO
- 2025-04-23 Rental Removed $1,850 APPFOLIO
- 2025-04-22 Pending — CRMLS
- 2025-04-19 Price Changed $1,850 APPFOLIO
- 2025-04-04 Price Changed $199,900 CRMLS
- 2025-04-02 Price Changed $204,900 CRMLS
- 2025-03-19 Price Changed $209,900 CRMLS
- 2025-03-15 Price Changed $214,900 CRMLS
- 2025-03-11 Listed $219,900 CRMLS
- 2025-03-04 Price Changed $1,999 APPFOLIO
- 2025-02-08 Price Changed $2,199 APPFOLIO
- 2025-02-01 Listed for Rent $2,499 APPFOLIO
- 2011-12-16 Listing Removed — CRMLS
- 2011-07-25 Listed $94,410 CRMLS
Property tax history
+0.7%/yrLatest (2025): $2,333 · +0.2% YoY. Source: county tax records.
Cash-flow waterfall
monthlySold comps — $/sqft
last 12 mo · ≤1 miLoading sold comps…