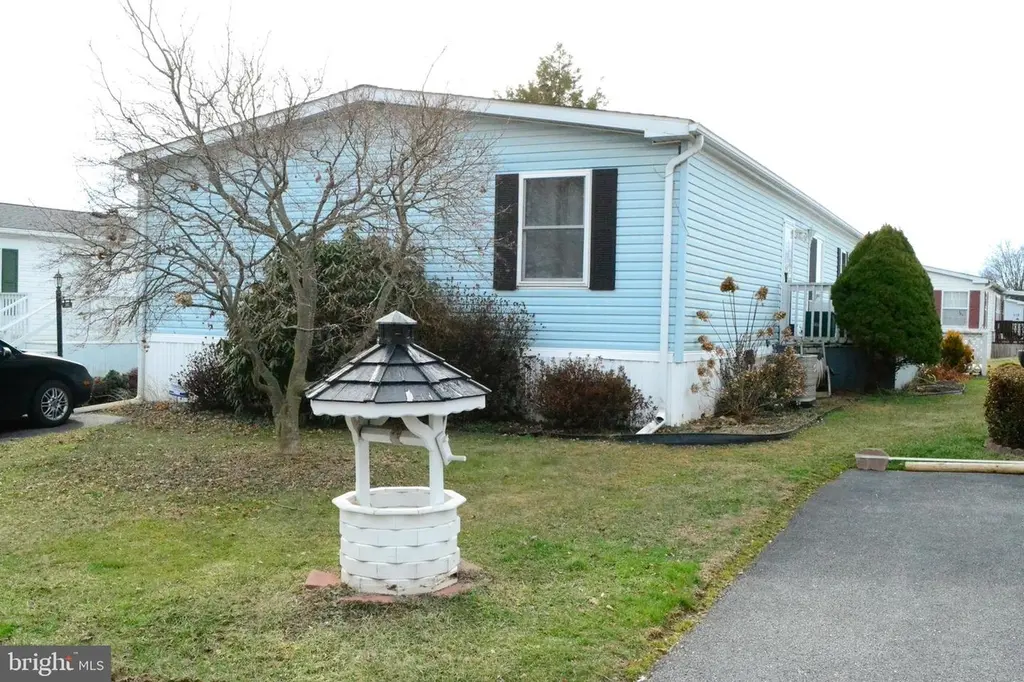
105 Bridlewood Ct S
Manor, PA 17603
$114,900D
3 bd · 2.0 ba ·
1,568 sqft ·
Built 1996
· Manufactured
· Pending
· 19 DOM
Cashflow @ list (25.0% down · 7.5%)
Estimated rent
$1,912/mo
Mortgage (P&I)
−$603
Tax + insurance
−$131
HOA
−$850
Vac / Maint / Mgmt
−$401
Net cashflow
$-73/mo
Annual
$-880/yr
Cap rate
5.53%
Cash-on-cash
-2.74%
DSCR
0.88
1% rule
1.66%
Cash to close
$32,172
Investor read
- This is a 3-bed/2.0-bath manufactured listed at $115k.
- At list price, monthly cash flow is $-73 ($-880/yr) — negative.
- To cash-flow at today's rent, offer at most $102k (11.3% below list).
- Meets the 1% rule at list price ($2k rent vs $115k).
- It's been on market 19 days — a 2% lower offer ($113k) is reasonable based on typical stale-listing flexibility.
- Recommended offer: $102k (11.3% below list) — sets the bar for cash-flow.
- Local home prices are declining (-3.0%/yr); year-one equity from $794 of loan paydown is wiped out by about $3k of value loss. Plan a longer hold.
- Location reads 68/100 on livability (#888 in PA) — a middle-class / working-renter tenant base. Strengths: crime A+, employment A+, cost of living A+; Watch: schools D, amenities F, commute F.
- Penn Manor SD (suburban): math 52% / reading 65% proficiency, ranked #80 of 539 in PA (top 15%) — acceptable for families but not a draw, mixed tenant base, ~2y average lease.
- Watch-outs: HOA is 44% of rent.
- Market conditions: Rents flat; 292 active listings in the ZIP; 11 comparable units currently listed for rent nearby; rentals at typical pace (median 14d on market — plan ~3-4 weeks tenant-placement turnaround); solid renter incomes; 1,093 units permitted in Lancaster County in 2024 (201 in 5+ unit buildings).
- Lancaster County population projected at +5% by 2050 — modest demand growth; plan on rents tracking national, not racing it.
- Climate carrying-cost: extreme-heat days projected 7→15/yr by 2055 (HVAC capex compounding) — expect insurance premiums to compound above CPI over the hold.
- Cap rate 5.5% vs local median 3.3% in Manor — top-decile yield for the area; either an underpriced asset or a hidden risk that comps aren't pricing in. Stress-test before assuming the spread holds.
Questions for listing agent
- What do current leases actually rent for vs. the listed asking? Can we see a recent rent roll and the last 12 months of T-12 income?
- What does the HOA fee cover, when was the last increase, and are there any pending special assessments or reserve-fund shortfalls?
- Is there a deadline driving the sale (1031 exchange, divorce, estate, relocation)? That informs how much negotiation room exists.
- Schools are D-rated, which usually means shorter tenancies and higher turnover. Who's the typical renter profile here, and what's been the actual vacancy rate?
- The area grade is low — what's the realistic commute time and amenity access for the typical tenant pool here? Any planned neighborhood developments (good or bad) we should know about?
- What's the average days-on-market for RENTAL listings here right now (not sales)? A rising rental-DOM trend means longer vacancies and softer asking-rent achievability than the comps imply.
- What's the recent tenant-quality profile in this submarket — average credit score on applications, eviction rate, late-payment / NSF rate, and stable-employment percentage? A property-management company in the area should have these aggregated.
- How much new for-sale + rental construction is in the pipeline within 1–3 miles? Heavy new supply typically softens prices + rents 12–24 months out; constrained supply supports both.
CashFlowRE · CFR-3F7AVQCBKDTG4Z
· Data 1 week ago
cashflowre.app · 2026-05-29