105 Bridlewood Ct S · Manor, PA
Flood risk 1/10 · Minimal
- FEMA flood zone
- X (unshaded)
- Chance of flooding over 30 yrs
- 0.0%
- Est. flood insurance / yr
- $507 – $1,088
Fire risk 2/10 · Minimal
- Est. fire insurance / yr
- $511 – $949
Heat risk 6/10 · Moderate
- Hot days now (above 101°F)
- 7 days/yr
- Hot days in 30 yrs
- 15 days/yr
Wind risk 4/10 · Minor
- Chance of severe wind over 30 yrs
- 13.0%
Air-quality risk 4/10 · Minor
- Unhealthy air days now
- 4 days/yr
- Unhealthy air days in 30 yrs
- 7 days/yr
Risk factors via First Street. Map © Google.
Why this score? — see what drove the D grade
The composite is a weighted blend of 9 inputs, each scored 0–100. Each bar is that input's sub-score; the figure is the points it added to the 100-point composite (weight × sub-score).
- 1% rule +10.0/10.0
- Cash flow +9.8/30.0
- ARV discount +7.5/15.0
- Schools +5.1/10.0
- Livability +3.4/5.0
- DSCR +2.8/10.0
- Rent growth +2.6/5.0
- Condition / age +2.5/5.0
- Appreciation +0.0/10.0
$114,900
🖨 Deal sheet 📄 Offer letter ✓ Due diligence
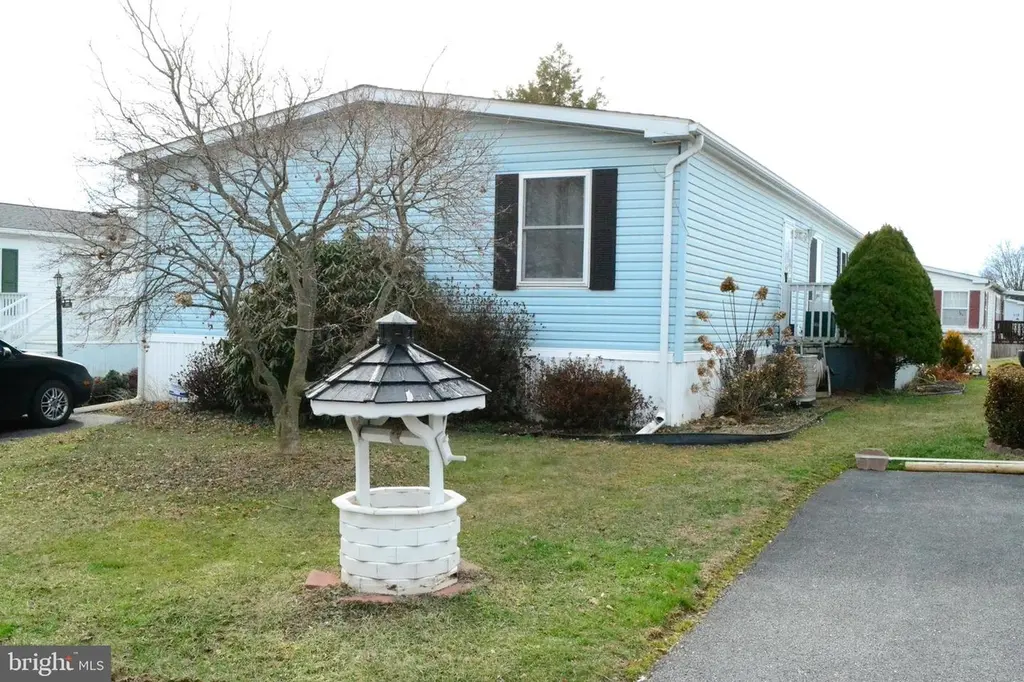
Listing remarks
Rare 4-bedroom find! This spacious, double-wide mobile home offers plenty of room to spread out and enjoy. Recent upgrades include a newer dishwasher, garbage disposal, dryer, fresh paint, and added shelving throughout. Nearly all flooring has been updated, with just one bedroom remaining. The home is well-maintained and move-in ready, featuring relaxing front and rear decks—perfect for unwinding or entertaining. Enjoy the community amenities, including a clubhouse, swimming pool, fitness center, playground, and basketball court—offering the ideal combination of easy living and an active lifestyle.
Key facts
- Community pool
- Built 1996
- Listed 19 days
Neighborhood map
What this means for you Summary
Snapshot
- This is a 3-bed/2.0-bath manufactured listed at $115k.
Deal economics
- At list price, monthly cash flow is $-73 ($-880/yr) — negative.
- To cash-flow at today's rent, offer at most $102k (11.3% below list).
- Meets the 1% rule at list price ($2k rent vs $115k).
- Recommended offer: $102k (11.3% below list) — sets the bar for cash-flow.
- Cap rate 5.5% vs local median 3.3% in Manor — top-decile yield for the area; either an underpriced asset or a hidden risk that comps aren't pricing in. Stress-test before assuming the spread holds.
Location & tenants
- Location reads 68/100 on livability (#888 in PA) — a middle-class / working-renter tenant base. Strengths: crime A+, employment A+, cost of living A+; Watch: schools D, amenities F, commute F.
- Penn Manor SD (suburban): math 52% / reading 65% proficiency, ranked #80 of 539 in PA (top 15%) — acceptable for families but not a draw, mixed tenant base, ~2y average lease.
- Market conditions: Rents flat; 292 active listings in the ZIP; 11 comparable units currently listed for rent nearby; rentals leasing fast (median 14d on market — plan ~1-2 weeks tenant-placement turnaround); solid renter incomes; 1,093 units permitted in Lancaster County in 2024 (201 in 5+ unit buildings).
Forward outlook
- Local home prices are declining (-3.0%/yr); year-one equity from $794 of loan paydown is wiped out by about $3k of value loss. Plan a longer hold.
- Lancaster County population projected at +5% by 2050 — modest demand growth; plan on rents tracking national, not racing it.
Negotiation context
- It's been on market 19 days — a 2% lower offer ($113k) is reasonable based on typical stale-listing flexibility.
Risks & watch-outs
- Watch-outs: HOA is 44% of rent.
- Climate carrying-cost: extreme-heat days projected 7→15/yr by 2055 (HVAC capex compounding) — expect insurance premiums to compound above CPI over the hold.
Questions for the listing agent
- What do current leases actually rent for vs. the listed asking? Can we see a recent rent roll and the last 12 months of T-12 income?
- What does the HOA fee cover, when was the last increase, and are there any pending special assessments or reserve-fund shortfalls?
- Is there a deadline driving the sale (1031 exchange, divorce, estate, relocation)? That informs how much negotiation room exists.
- Schools are D-rated, which usually means shorter tenancies and higher turnover. Who's the typical renter profile here, and what's been the actual vacancy rate?
- The area grade is low — what's the realistic commute time and amenity access for the typical tenant pool here? Any planned neighborhood developments (good or bad) we should know about?
- What's the average days-on-market for RENTAL listings here right now (not sales)? A rising rental-DOM trend means longer vacancies and softer asking-rent achievability than the comps imply.
- What's the recent tenant-quality profile in this submarket — average credit score on applications, eviction rate, late-payment / NSF rate, and stable-employment percentage? A property-management company in the area should have these aggregated.
- How much new for-sale + rental construction is in the pipeline within 1–3 miles? Heavy new supply typically softens prices + rents 12–24 months out; constrained supply supports both.
Investment metrics
- 1% rule
- 1.66% ✓
- Cap rate
- 5.53%
- Cash-on-cash
- -2.74%
- DSCR
- 0.88
- GRM
- 5.0
CMA / ARV
No comps found within radius.
Projected returns pro-forma
-3.0% appreciation · 0.47% rent growth · sell at horizon
- IRR
- -26.4%
- Equity multiple
- 0.14×
- Total profit
- $-27,522
- Equity at exit
- $17,132
- IRR
- -58.6%
- Equity multiple
- -0.44×
- Total profit
- $-46,407
- Equity at exit
- $9,934
Cash invested: $32,172 (down + closing). Projections, not guarantees.
Landlord ↔ Tenant lean methodology
- Overall (STATE)
- 62 Landlord-Friendly
- State Pennsylvania
- 62 Landlord-Friendly · EVEN
- County
- — inherits STATE
- City
- — inherits STATE
ZIP-level market 17603
- Rents YoY
- 0.5%
- Active inventory
- 292
- Price-to-rent
- 5.0×
Monthly cashflow live
- Estimated rent
- $1,912 high interval (Pro) →
- Mortgage (P&I)
- −$603
- Tax from tax record
- −$83 /mo · $997/yr
- Insurance
- −$48
- HOA
- −$850
- Vacancy / Maint / Mgmt
- −$401
- Net cashflow
- $-73
Break-even live
UW: 25.0% down · 7.5% · 30yr · 1.5% tax · 5.0% vac · 8.0% maint · 8.0% mgmt
Financing live
Cash to close
- Down payment
- $28,725
- Closing costs
- $3,447
- Reserves months
- —
- Total cash needed
- —
Loan-product check · same deal, 3 products live
Conventional
25% down · 7.5% · 30yr
- Down + closing
- —
- Monthly P&I
- —
- Monthly cashflow
- —
- DSCR
- —
- Eligible?
- —
Personal DTI + credit; lowest rate.
DSCR
20% down · 8.5% · 30yr
- Down + closing
- —
- Monthly P&I
- —
- Monthly cashflow
- —
- DSCR
- —
- Eligible?
- —
No personal income docs; deal must DSCR.
Hard money
10% down · 12.0% · 12mo
- Down + closing
- —
- Monthly P&I
- —
- Monthly cashflow
- —
- DSCR
- —
- Eligible?
- —
Short-term bridge; refi at stabilization.
Rent comps 11 comps
| Address | Beds | Baths | Sqft | Rent | $/sqft | DOM | Units | Dist |
|---|---|---|---|---|---|---|---|---|
| 250 Stone Mill Rd Lancaster, PA | 1.0–3.0 | 1.0 | 1002 | $1,575 | $1.57 | 13d | 1 | 0.32mi |
| 100 Country View Ln Millersville, PA | 1.0–2.0 | 1.0–2.0 | 970 | $1,838 | $1.89 | 13d | 6 | 0.84mi |
| 1415 Spencer Ave Lancaster, PA | 1.0–3.0 | 1.0–2.0 | 1181 | $3,720 | $3.15 | 13d | 1 | 0.94mi |
| 1121 Spring Grove Ave Lancaster, PA | 4.0 | 2.0 | 1755 | $2,200 | $1.25 | 43d | 1 | 1.02mi |
| 101 Roselawn Ave Lancaster, PA | 3.0 | 2.0 | 1166 | $1,785 | $1.53 | 13d | 1 | 1.20mi |
| 27 Roselle Ave Lancaster, PA | 2.0 | 1.0 | 1128 | $1,575 | $1.40 | 43d | 1 | 1.23mi |
| 135 Grandview Ave Lancaster, PA | 3.0 | 2.0 | 1395 | $3,295 | $2.36 | 13d | 1 | 1.28mi |
| 611 S West End Ave Lancaster, PA | 4.0 | 1.5 | 1589 | $1,800 | $1.13 | 13d | 1 | 1.31mi |
| 1115 Marietta Ave Unit WH15037 Lancaster, PA | 2.0 | 2.0 | 1298 | $1,695 | $1.31 | 43d | 1 | 1.35mi |
| 1633A Judie Ln Lancaster, PA | 1.0–2.0 | 1.0–2.0 | 848 | $1,698 | $2.00 | 13d | 13 | 1.38mi |
| 1831 Hidden Ln Lancaster, PA | 2.0–3.0 | 1.5–2.5 | 1182 | $2,114 | $1.79 | 13d | 3 | 1.40mi |
HOA detail
- Monthly dues
- $850 · $10,200/yr
- Likely covers
- trashpoolgym
Listing history 2 events
-
2026-04-25status Pending
-
2026-04-06$114,900 Active
ⓘ Source: listings_history table (triggers on properties + properties_extension) + one-shot
backfill from property_details.listing_events for pre-trigger history.
Tax reassessment forecast PA · Partial reset (capped growth)
- Current annual tax
- $997 · $83/mo
- Projected year-2 tax
- $1,406 · $117/mo
- Expected delta
- +$409/yr (+$34/mo · 41.0%)
ⓘ Screening estimate from a state-policy table — verify with the county assessor before closing.
Climate risk First Street
- Flood 1/10 Low FEMA zone X (unshaded) · 0% chance over 30 yrs
- Wildfire 2/10 Low
- Heat 6/10 Major 7 d/yr ≥101°F today · 15 d/yr by 30 yrs out
- Wind 4/10 Moderate 13% chance of damaging wind over 30 yrs
- Air quality 4/10 Moderate 4 unhealthy d/yr today · 7 by 30 yrs out
Nearby sold comps map
Loading sold comps map…
Walkable amenities ~0.75 mi
Loading nearby amenities…
Taxation est. · year 1
- Rental income
- $22,940
- − Mortgage interest
- −$6,436
- − Property taxes
- −$997
- − Insurance
- −$574
- − Repairs & maintenance
- −$1,835
- − Management
- −$1,835
- − HOA
- −$10,200
- − Depreciation
- −$3,343
- Taxable loss
- −$2,281
- Est. tax savings @ 24.0%
- +$548
- After-tax cash flow
- $-333/yr
For passive investors: Depreciation is non-cash, so a rental often shows a tax loss while cash-flowing — sheltering income. Rental losses are passive: they offset passive income freely, and up to $25,000/yr can offset ordinary (W-2) income if you actively participate and your MAGI is under $100k (phasing out to $0 by $150k); unused losses carry forward. On sale, claimed depreciation is recaptured at up to 25%, and gains may owe capital-gains tax (a 1031 exchange can defer both). Figures are a year-1 estimate at your 24.0% rate — not tax advice; consult a CPA.
Schools (NCES district)
- District
- Penn Manor SD
- NCES district ID
- 4218630
- Math proficiency
- 52% ▼ -7.00%
- Reading proficiency
- 65% ▼ -7.00%
- Median HH income
- $59,275
- Composite
- 50.67/100
- National rank
- #1826
- State rank
- #80 of 539 in PA
Livability — Manor
- Score
- 68/100
- State rank
- #888
- US rank
- #9450
Category grades
Schools grade is shown separately in the Schools card above.
Census & demographics
- County
- Lancaster County · 390,309 people
- City population
- 1,171
- Metro
- Lancaster, PA
- Population (ZIP)
- 67,571
- Household income
- $77,084
- Rent vs Own
- Severe rent burden
- 2557.0
Population outlook (Lancaster County) Hauer SSP2
- Today (2025)
- 561,011 people
- By 2030
- 570,969 · +1.8%
- By 2040
- 585,929 · +4.4%
- By 2050
- 591,056 · +5.4%
- By 2075
- 594,747 · +6.0%
- By 2100
- 558,850 · -0.4%
Race, ethnicity, and origin ACS 2023
- Neighborhood character
- Diverse neighborhood (Simpson 0.59)
- Race & ethnicity
- White 58% Hispanic / Latino 27% Two or more races 12% Black 7% Asian 4%
- Hispanic origin (detail)
- Mexican 1% Puerto Rican 19% Cuban 1% Dominican 2%
- Common ancestry
- Romanian 2% Slovak 2% Lithuanian 1%
- Foreign-born
- 9% · Canada, China, India
- Languages at home
- 77% English-only · Spanish 17% Other Indo-European 1% Chinese 1%
Political lean MEDSL · Lancaster
- 2024 margin
- R (+15.9) · D 41.5% · R 57.5%
- 2008→2024 swing
- -4.1pp toward R · 2008: -11.8pp · 2024: -15.9pp
- All cycles
- 2024: R+15.9 2020: R+15.8 2016: R+19.7 2012: R+19.2 2008: R+11.8
Not yet ingested
- Civics
- —
Market trends
- HPI YoY
- ▼ -508.78%
- Current HPI
- 289.3324
- Rent YoY
- ▲ 0.47%
- Metro
- Lancaster, PA
- State GDP YoY
- ▲ 1.68%
- F500 in state
- 34
Industry mix (Fortune 500 HQ in PA)
| Industry | F500 HQs | Revenue |
|---|---|---|
| Healthcare | 2 | $309B |
|
||
| Insurance | 2 | $27B |
|
||
| Telecommunications / Media | 1 | $124B |
|
||
| Industrial Distribution | 1 | $22B |
|
||
| Financial Services | 1 | $20B |
|
||
| Chemicals / Materials | 1 | $18B |
|
||
Price history
2 events — show timeline
- 2026-04-25 Pending — BRIGHT MLS
- 2026-04-06 Listed $114,900 BRIGHT MLS
Property tax history
-0.4%/yrLatest (2026): $997 · +4.1% YoY. Source: county tax records.
Cash-flow waterfall
monthlySold comps — $/sqft
last 12 mo · ≤1 miLoading sold comps…