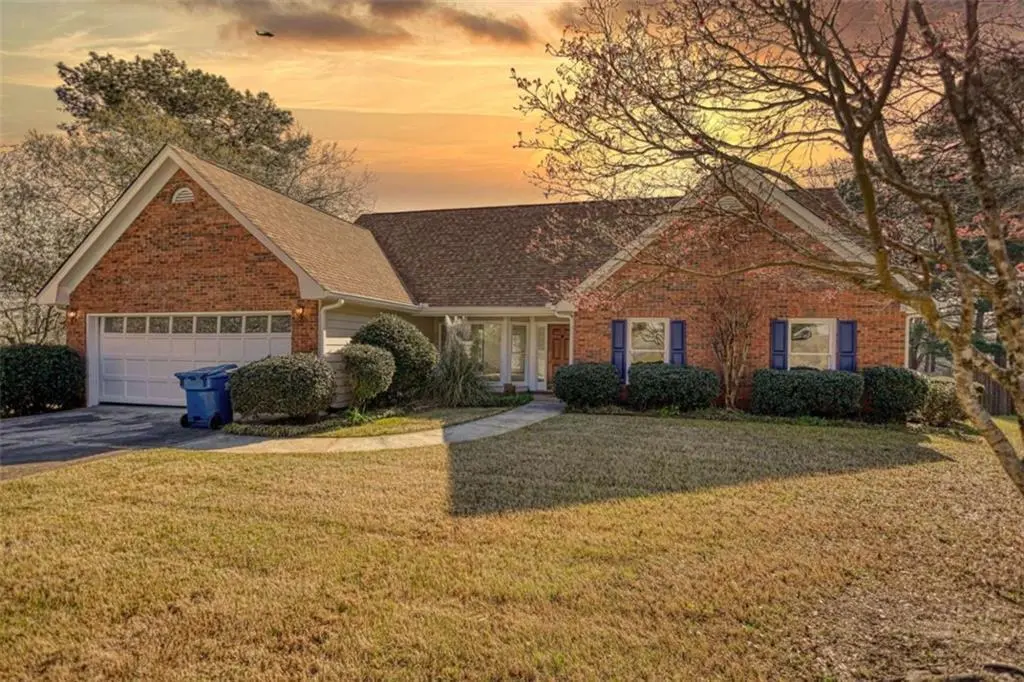
1280 Stone Bridge Ct SW
Stonecrest, GA 30094
$285,000D-
3 bd · 2.0 ba ·
1,574 sqft ·
Built 1992
· SingleFamily
· Pending
· 36 DOM
Cashflow @ list (25.0% down · 7.5%)
Estimated rent
$2,198/mo
Mortgage (P&I)
−$1,495
Tax + insurance
−$258
HOA
−$0
Vac / Maint / Mgmt
−$462
Net cashflow
$-16/mo
Annual
$-189/yr
Cap rate
6.23%
Cash-on-cash
-0.24%
DSCR
0.99
1% rule
0.77%
Cash to close
$79,800
Investor read
- This is a 3-bed/2.0-bath single-family listed at $285k.
- At list price, monthly cash flow is $-16 ($-189/yr) — negative.
- To cash-flow at today's rent, offer at most $282k (1.0% below list).
- To meet the 1% rule (rent ≥ 1% of price), the offer needs to be $220k (22.9% below list).
- It's been on market 36 days — a 3% lower offer ($276k) is reasonable based on typical stale-listing flexibility.
- Recommended offer: $220k (22.9% below list) — sets the bar for 1% rule.
- Local home prices are declining (-3.0%/yr); year-one equity from $2k of loan paydown is wiped out by about $9k of value loss. Plan a longer hold.
- Location reads: area grade D — affects rentability + tenant quality, not the cash-flow math above.
- Rockdale County (suburban): math 14% / reading 29% proficiency, ranked #136 of 174 in GA (top 78%) — low school quality limits family demand, transient renter base, plan for 1-2y turnover.
- Market conditions: Rents rising fast (+4.2%/yr); 390 active listings in the ZIP; 6 comparable units currently listed for rent nearby; rentals at typical pace (median 18d on market — plan ~3-4 weeks tenant-placement turnaround); solid renter incomes; 483 units permitted in Rockdale County in 2024 (0 in 5+ unit buildings).
- Rockdale County population projected at +29% by 2050 — long-run rental-demand tailwind backs the buy-and-hold thesis.
- 4 sale attempts with the ask held roughly flat each time — persistent listings suggest the price (not the market) is what's stuck; bring a comps-based counter.
- Current owner paid $110k; list at $285k implies a 159% gain — meaningful room to come down on a strong offer.
- Climate carrying-cost: moderate wind risk, 26% chance of damaging wind over 30y; extreme-heat days projected 7→18/yr by 2055 (HVAC capex compounding) — expect insurance premiums to compound above CPI over the hold.
- Cap rate 6.2% vs local median 5.1% in Stonecrest — meaningfully above typical; check what's discounted (condition, days-on-market, listing class) to confirm the premium yield is real.
Questions for listing agent
- What do current leases actually rent for vs. the listed asking? Can we see a recent rent roll and the last 12 months of T-12 income?
- It's been on market 36 days. Have you received any prior offers? Is the seller open to a 23% concession, seller financing, or rate buy-down credit?
- Is there a deadline driving the sale (1031 exchange, divorce, estate, relocation)? That informs how much negotiation room exists.
- The area grade is low — what's the realistic commute time and amenity access for the typical tenant pool here? Any planned neighborhood developments (good or bad) we should know about?
- What's the average days-on-market for RENTAL listings here right now (not sales)? A rising rental-DOM trend means longer vacancies and softer asking-rent achievability than the comps imply.
- What's the recent tenant-quality profile in this submarket — average credit score on applications, eviction rate, late-payment / NSF rate, and stable-employment percentage? A property-management company in the area should have these aggregated.
- How much new for-sale + rental construction is in the pipeline within 1–3 miles? Heavy new supply typically softens prices + rents 12–24 months out; constrained supply supports both.
CashFlowRE · CFR-3G9FVB4F7K1S8C
· Data 2 weeks ago
cashflowre.app · 2026-05-29