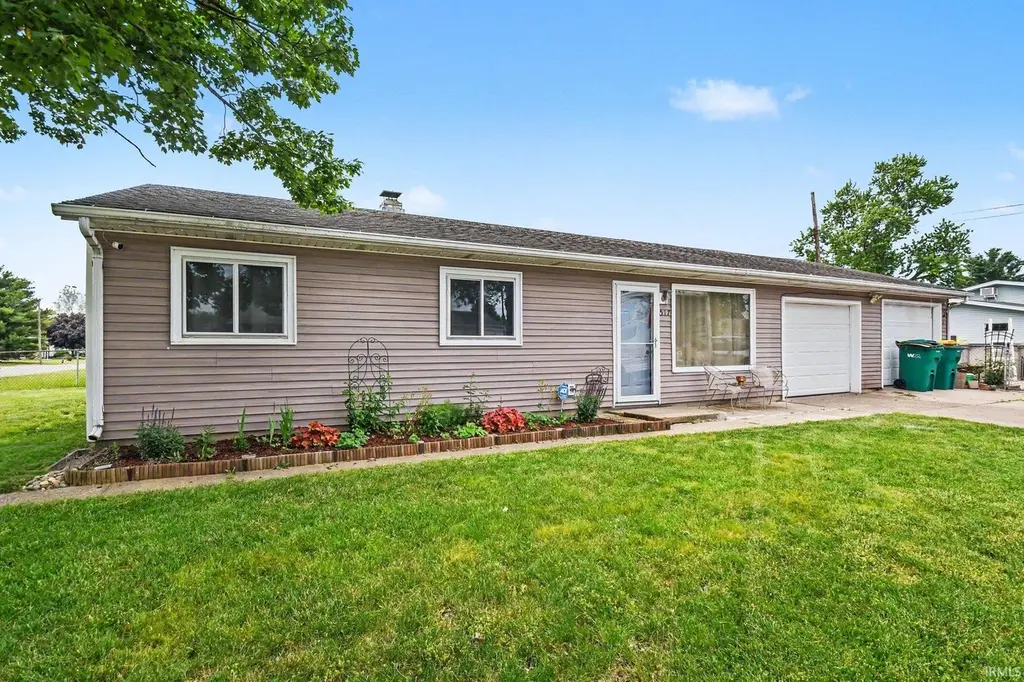
517 E La Salle Ave
Mishawaka, IN 46545
$212,000F
2 bd · 1.0 ba ·
1,073 sqft ·
Built 1959
· SingleFamily
· Pending
· 2 DOM
Cashflow @ list (25.0% down · 7.5%)
Estimated rent
$1,436/mo
Mortgage (P&I)
−$1,112
Tax + insurance
−$202
HOA
−$0
Vac / Maint / Mgmt
−$301
Net cashflow
$-179/mo
Annual
$-2,149/yr
Cap rate
5.28%
Cash-on-cash
-3.62%
DSCR
0.84
1% rule
0.68%
Cash to close
$59,360
Investor read
- This is a 2-bed/1.0-bath single-family listed at $212k.
- At list price, monthly cash flow is $-179 ($-2k/yr) — negative.
- To cash-flow at today's rent, offer at most $180k (14.9% below list).
- To meet the 1% rule (rent ≥ 1% of price), the offer needs to be $144k (32.3% below list).
- Only 2 days on market — expect competitive offers; lowballing is unlikely to land.
- Recommended offer: $144k (32.3% below list) — sets the bar for 1% rule.
- Local home prices are declining (-3.0%/yr); year-one equity from $1k of loan paydown is wiped out by about $6k of value loss. Plan a longer hold.
- Location reads 76/100 on livability (#53 in IN, #3,586 nationally) — a middle-class / working-renter tenant base. Strengths: cost of living A+, housing A+, health & safety B; Watch: amenities F, employment F.
- School City Of Mishawaka (urban): math 23% / reading 30% proficiency, ranked #260 of 301 in IN (top 86%) — low school quality limits family demand, transient renter base, plan for 1-2y turnover.
- Zoned schools: Liberty Elementary School (math 23% / reading 22%, grade F, #788 of 994 statewide, top 79%, 417 students, 80% FRL); John J Young Middle School (math 17% / reading 30%, grade F, #257 of 330 statewide, top 79%, 735 students, 74% FRL); Mishawaka High School (math 24% / reading 60%, grade F, #197 of 369 statewide, top 57%, 1,488 students, 65% FRL) — zoned schools average 73% FRL vs 54% district-wide (19 pts higher); higher-poverty schools than district average — tighter screening recommended.
- Watch-outs: built in 1959 — expect roof / HVAC / electrical / plumbing capex.
- Market conditions: Rents rising fast (+5.2%/yr); 74 active listings in the ZIP; 14 comparable units currently listed for rent nearby; rentals leasing fast (median 14d on market — plan ~1-2 weeks tenant-placement turnaround); 754 units permitted in St. Joseph County in 2024 (460 in 5+ unit buildings).
- This rent runs 30% of the median local income ($57k/yr) — at the standard rent-burdened threshold; future hikes will face affordability resistance.
Questions for listing agent
- What do current leases actually rent for vs. the listed asking? Can we see a recent rent roll and the last 12 months of T-12 income?
- Built in 1959 — when were the roof, HVAC, electrical panel, plumbing, and water heater last replaced?
- Is there a deadline driving the sale (1031 exchange, divorce, estate, relocation)? That informs how much negotiation room exists.
- The area grade is low — what's the realistic commute time and amenity access for the typical tenant pool here? Any planned neighborhood developments (good or bad) we should know about?
- What's the average days-on-market for RENTAL listings here right now (not sales)? A rising rental-DOM trend means longer vacancies and softer asking-rent achievability than the comps imply.
- What's the recent tenant-quality profile in this submarket — average credit score on applications, eviction rate, late-payment / NSF rate, and stable-employment percentage? A property-management company in the area should have these aggregated.
- How much new for-sale + rental construction is in the pipeline within 1–3 miles? Heavy new supply typically softens prices + rents 12–24 months out; constrained supply supports both.
CashFlowRE · CFR-3J3CCNDMWR3QB2
· Data 1 week ago
cashflowre.app · 2026-05-29