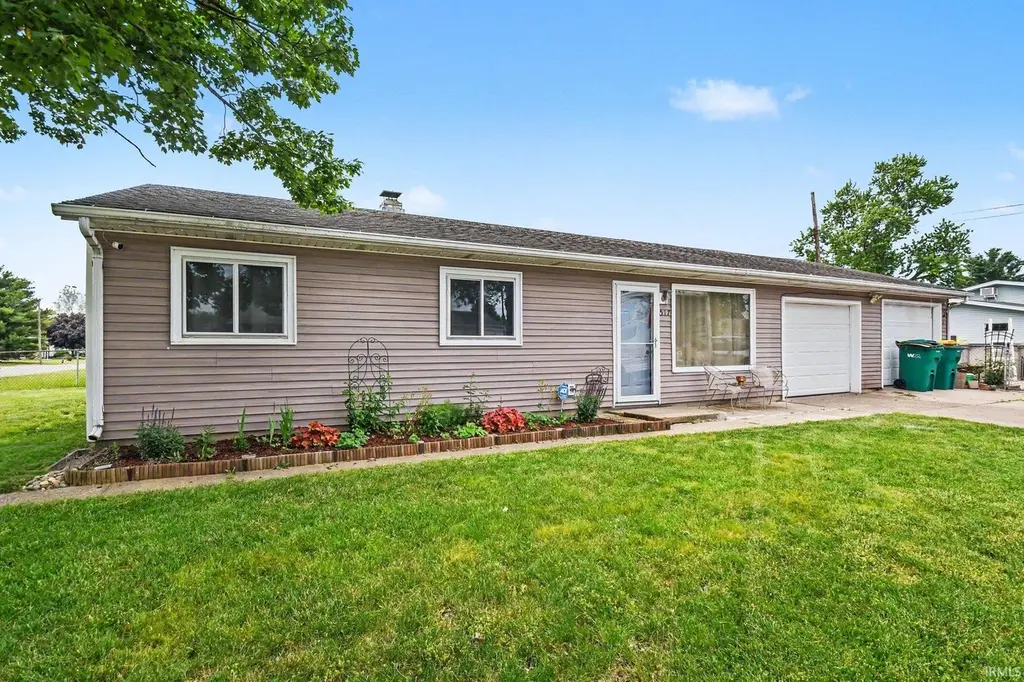
517 E La Salle Ave · Mishawaka, IN
Flood risk 1/10 · Minimal
- FEMA flood zone
- X (unshaded)
- Chance of flooding over 30 yrs
- 0.0%
- Est. flood insurance / yr
- $507 – $1,088
Fire risk 1/10 · Minimal
- Est. fire insurance / yr
- $717 – $1,331
Heat risk 3/10 · Minor
- Hot days now (above 100°F)
- 7 days/yr
- Hot days in 30 yrs
- 16 days/yr
Wind risk 2/10 · Minimal
- Chance of severe wind over 30 yrs
- —
Air-quality risk 3/10 · Minor
- Unhealthy air days now
- 2 days/yr
- Unhealthy air days in 30 yrs
- 3 days/yr
Risk factors via First Street. Map © Google.
Why this score? — see what drove the F grade
The composite is a weighted blend of 9 inputs, each scored 0–100. Each bar is that input's sub-score; the figure is the points it added to the 100-point composite (weight × sub-score).
- Cash flow +8.7/30.0
- Rent growth +3.8/5.0
- Livability +3.8/5.0
- Condition / age +2.5/5.0
- DSCR +2.4/10.0
- Schools +2.2/10.0
- 1% rule +1.8/10.0
- ARV discount +1.7/15.0
- Appreciation +0.0/10.0
$212,000
🖨 Deal sheet 📄 Offer letter ✓ Due diligence
Listing remarks
Charming and move in ready! This adorable 3 bedroom, 1 bath home is ideally located just minutes from downtown Mishawaka and the Riverwalk, offering easy access to shopping, dining, parks, and entertainment. Inside, you’ll find fresh paint and brand new carpet, making it easy to move right in and start enjoying your new home. The spacious backyard is perfect for relaxing or entertaining. Enjoy summer days in the above-ground swimming pool and make the most of the outdoor space. This home is perfect for first time homebuyers, growing families, or anyone seeking a move in ready home. This well maintained home offers charm, and value in a desirable location. Schedule your showing today!
Key facts
- Spacious backyard
- Move in ready
- Easy access to parks
Tags
Property features AI
Finance
- HOA & community: Community pool
Exterior
- Parking: Attached garage with 2 spaces
- Utilities: Public water; Public sewer
- Home design: Single-family residence; Site-built home; Single-story
- Construction: Vinyl siding; Slab foundation; Asphalt roof; Built as site-built home (year built not provided)
- Exterior features: Chain link fencing; Corner lot; Lot dimensions approximately 80 x 108
Interior
- Kitchen: Microwave; Refrigerator; Gas Oven; Gas Range
- Bedrooms: Total of 7 rooms (bedroom count not specified)
- Bathrooms: 1 full bathroom (main level)
- Heating & cooling: Natural gas heating; No cooling
- Interior features: Microwave; Refrigerator; Gas Oven; Gas Range
- Laundry & utility: Washer and Dryer provided; Laundry on main level
Neighborhood map
What this means for you Summary
Snapshot
- This is a 2-bed/1.0-bath single-family listed at $212k.
Deal economics
- At list price, monthly cash flow is $-179 ($-2k/yr) — negative.
- To cash-flow at today's rent, offer at most $180k (14.9% below list).
- To meet the 1% rule (rent ≥ 1% of price), the offer needs to be $144k (32.3% below list).
- Recommended offer: $144k (32.3% below list) — sets the bar for 1% rule.
Location & tenants
- Location reads 76/100 on livability (#53 in IN, #3,586 nationally) — a middle-class / working-renter tenant base. Strengths: cost of living A+, housing A+, health & safety B; Watch: amenities F, employment F.
- School City Of Mishawaka (urban): math 23% / reading 30% proficiency, ranked #260 of 301 in IN (top 86%) — low school quality limits family demand, transient renter base, plan for 1-2y turnover.
- Zoned schools: Liberty Elementary School (math 23% / reading 22%, grade F, #788 of 994 statewide, top 79%, 417 students, 80% FRL); John J Young Middle School (math 17% / reading 30%, grade F, #257 of 330 statewide, top 79%, 735 students, 74% FRL); Mishawaka High School (math 24% / reading 60%, grade F, #197 of 369 statewide, top 57%, 1,488 students, 65% FRL) — zoned schools average 73% FRL vs 54% district-wide (19 pts higher); higher-poverty schools than district average — tighter screening recommended.
- Market conditions: Rents rising fast (+5.2%/yr); 74 active listings in the ZIP; 14 comparable units currently listed for rent nearby; rentals leasing fast (median 14d on market — plan ~1-2 weeks tenant-placement turnaround); 754 units permitted in St. Joseph County in 2024 (460 in 5+ unit buildings).
- This rent runs 30% of the median local income ($57k/yr) — at the standard rent-burdened threshold; future hikes will face affordability resistance.
Forward outlook
- Local home prices are declining (-3.0%/yr); year-one equity from $1k of loan paydown is wiped out by about $6k of value loss. Plan a longer hold.
Negotiation context
- Only 2 days on market — expect competitive offers; lowballing is unlikely to land.
Risks & watch-outs
- Watch-outs: built in 1959 — expect roof / HVAC / electrical / plumbing capex.
Questions for the listing agent
- What do current leases actually rent for vs. the listed asking? Can we see a recent rent roll and the last 12 months of T-12 income?
- Built in 1959 — when were the roof, HVAC, electrical panel, plumbing, and water heater last replaced?
- Is there a deadline driving the sale (1031 exchange, divorce, estate, relocation)? That informs how much negotiation room exists.
- The area grade is low — what's the realistic commute time and amenity access for the typical tenant pool here? Any planned neighborhood developments (good or bad) we should know about?
- What's the average days-on-market for RENTAL listings here right now (not sales)? A rising rental-DOM trend means longer vacancies and softer asking-rent achievability than the comps imply.
- What's the recent tenant-quality profile in this submarket — average credit score on applications, eviction rate, late-payment / NSF rate, and stable-employment percentage? A property-management company in the area should have these aggregated.
- How much new for-sale + rental construction is in the pipeline within 1–3 miles? Heavy new supply typically softens prices + rents 12–24 months out; constrained supply supports both.
Investment metrics
- 1% rule
- 0.68% ✗
- Cap rate
- 5.28%
- Cash-on-cash
- -3.62%
- DSCR
- 0.84
- GRM
- 12.3
CMA / ARV
- ARV (on-the-fly)
- $187,775
- Comps found
- 12
Show comp detail 12 sales within ~0.75 mi
| Address | Dist | Beds/Ba | Sqft | Sold | Price | $/sf | Match |
|---|---|---|---|---|---|---|---|
| 239 E Edgar Ave | 0.28mi | 2/2.0 | 1,066 (-1%) | 2mo | $185,000 | $174 | 80 |
| 125 E Omer Ave | 0.28mi | 2/1.0 | 1,131 (+5%) | 4mo | $170,600 | $151 | 74 |
| 135 Guam Ave | 0.36mi | 3/1.0 (+1) | 1,103 (+3%) | 2mo | $179,900 | $163 | 72 |
| 201 E Russ Ave | 0.24mi | 3/1.0 (+1) | 1,008 (-6%) | 4mo | $210,000 | $208 | 71 |
| 239 E Jefferson Blvd | 0.43mi | 2/1.0 | 1,020 (-5%) | 6mo | $84,000 | $82 | 67 |
| 209 E Borley Ave | 0.40mi | 3/2.0 (+1) | 1,128 (+5%) | 1mo | $215,000 | $191 | 62 |
| 2604 Normandy Dr | 0.43mi | 3/1.5 (+1) | 1,198 (+12%) | 1mo | $175,000 | $146 | 53 |
| 2424 Normandy Dr | 0.34mi | 2/2.0 | 916 (-15%) | 4mo | $172,000 | $188 | 52 |
| 1215 E Borley Ave | 0.65mi | 3/2.0 (+1) | 1,140 (+6%) | 4mo | $199,500 | $175 | 47 |
| 131 E Marion St | 0.62mi | 2/1.5 | 1,232 (+15%) | 1mo | $172,000 | $140 | 44 |
| 1002 E Broadway St | 0.66mi | 3/2.0 (+1) | 1,172 (+9%) | 2mo | $205,000 | $175 | 43 |
| 2530 Grape Rd | 0.68mi | 3/2.0 (+1) | 1,212 (+13%) | 6mo | $215,000 | $177 | 32 |
Match score weights: distance 35% · size 25% · config 20% · recency 20%. Top-matched comps best support the ARV.
Projected returns pro-forma
-3.0% appreciation · 5.2% rent growth · sell at horizon
- IRR
- -20.3%
- Equity multiple
- 0.28×
- Total profit
- $-42,584
- Equity at exit
- $31,610
- IRR
- -9.7%
- Equity multiple
- 0.36×
- Total profit
- $-38,120
- Equity at exit
- $18,330
Cash invested: $59,360 (down + closing). Projections, not guarantees.
Landlord ↔ Tenant lean methodology
- Overall (STATE)
- 90 Strongly Landlord-Friendly
- State Indiana
- 90 Strongly Landlord-Friendly · R+11
- County
- — inherits STATE
- City
- — inherits STATE
ZIP-level market 46545
- Rents YoY
- 5.2%
- Active inventory
- 74
- Price-to-rent
- 12.3×
Monthly cashflow live
- Estimated rent
- $1,436 high interval (Pro) →
- Mortgage (P&I)
- −$1,112
- Tax from tax record
- −$113 /mo · $1,358/yr
- Insurance
- −$88
- HOA
- −$0
- Vacancy / Maint / Mgmt
- −$301
- Net cashflow
- $-179
Break-even live
UW: 25.0% down · 7.5% · 30yr · 1.5% tax · 5.0% vac · 8.0% maint · 8.0% mgmt
Financing live
Cash to close
- Down payment
- $53,000
- Closing costs
- $6,360
- Reserves months
- —
- Total cash needed
- —
Loan-product check · same deal, 3 products live
Conventional
25% down · 7.5% · 30yr
- Down + closing
- —
- Monthly P&I
- —
- Monthly cashflow
- —
- DSCR
- —
- Eligible?
- —
Personal DTI + credit; lowest rate.
DSCR
20% down · 8.5% · 30yr
- Down + closing
- —
- Monthly P&I
- —
- Monthly cashflow
- —
- DSCR
- —
- Eligible?
- —
No personal income docs; deal must DSCR.
Hard money
10% down · 12.0% · 12mo
- Down + closing
- —
- Monthly P&I
- —
- Monthly cashflow
- —
- DSCR
- —
- Eligible?
- —
Short-term bridge; refi at stabilization.
Rent comps 14 comps
| Address | Beds | Baths | Sqft | Rent | $/sqft | DOM | Units | Dist |
|---|---|---|---|---|---|---|---|---|
| 209 E Edgar Ave Mishawaka, IN | 3.0 | 1.0 | 1400 | $1,400 | $1.00 | 13d | 1 | 0.33mi |
| 117 Palau Ave Mishawaka, IN | 3.0 | 1.0 | 1100 | $1,650 | $1.50 | 13d | 1 | 0.57mi |
| 602 E Battell St Mishawaka, IN | 1.0 | 1.0 | 980 | $1,400 | $1.43 | 21d | 1 | 0.68mi |
| 303 Village Dr Mishawaka, IN | 1.0–3.0 | 1.0–1.5 | 918 | $1,619 | $1.76 | 13d | 25 | 0.76mi |
| 302 Village Dr Mishawaka, IN | 1.0–3.0 | 1.0–1.5 | 950 | $1,591 | $1.67 | 13d | 33 | 0.78mi |
| 232 E Grove St Mishawaka, IN | 3.0 | 1.0 | 1188 | $1,500 | $1.26 | 13d | 1 | 0.83mi |
| 724 Elizabeth St Mishawaka, IN | 1.0 | 1.0 | 850 | $875 | $1.03 | 13d | 1 | 0.87mi |
| 1918 N Byrkit St Mishawaka, IN | 2.0 | 1.0 | 770 | $1,250 | $1.62 | 13d | 1 | 0.91mi |
| 116 W Mishawaka Ave Mishawaka, IN | 3.0 | 1.0–2.0 | 948 | $1,914 | $2.02 | 13d | 31 | 0.93mi |
| 300 Pin Oak Cir Mishawaka, IN | 1.0–3.0 | 1.0–1.5 | 835 | $1,052 | $1.26 | 13d | 1 | 0.94mi |
| 365 W Front St Mishawaka, IN | 2.0 | 1.0–2.0 | 825 | $3,050 | $3.70 | 13d | 1 | 1.21mi |
| 516 W 3rd St Apt 1 Mishawaka, IN | 1.0 | 1.0 | 750 | $800 | $1.07 | 21d | 1 | 1.42mi |
| 516 W 3rd St #6 Mishawaka, IN | 2.0 | 1.0 | 700 | $800 | $1.14 | 13d | 1 | 1.42mi |
| 3001 E Jefferson Blvd South Bend, IN | 1.0–2.0 | 1.0–2.0 | 848 | $1,329 | $1.57 | 13d | 21 | 1.45mi |
Listing history 2 events
-
2026-06-07remarks 693-char remark
-
2026-06-07$212,000 Pending 2 DOM
ⓘ Source: listings_history table (triggers on properties + properties_extension) + one-shot
backfill from property_details.listing_events for pre-trigger history.
Tax reassessment forecast IN · Partial reset (capped growth)
- Current annual tax
- $1,358 · $113/mo
- Projected year-2 tax
- $1,580 · $132/mo
- Expected delta
- +$222/yr (+$18/mo · 16.3%)
ⓘ Screening estimate from a state-policy table — verify with the county assessor before closing.
Climate risk First Street
- Flood 1/10 Low FEMA zone X (unshaded) · 0% chance over 30 yrs
- Wildfire 1/10 Low
- Heat 3/10 Moderate 7 d/yr ≥100°F today · 16 d/yr by 30 yrs out
- Wind 2/10 Low
- Air quality 3/10 Moderate 2 unhealthy d/yr today · 3 by 30 yrs out
Nearby sold comps map
Loading sold comps map…
Walkable amenities ~0.75 mi
Loading nearby amenities…
Taxation est. · year 1
- Rental income
- $17,228
- − Mortgage interest
- −$11,875
- − Property taxes
- −$1,358
- − Insurance
- −$1,060
- − Repairs & maintenance
- −$1,378
- − Management
- −$1,378
- − Depreciation
- −$6,167
- Taxable loss
- −$5,989
- Est. tax savings @ 24.0%
- +$1,437
- After-tax cash flow
- $-712/yr
For passive investors: Depreciation is non-cash, so a rental often shows a tax loss while cash-flowing — sheltering income. Rental losses are passive: they offset passive income freely, and up to $25,000/yr can offset ordinary (W-2) income if you actively participate and your MAGI is under $100k (phasing out to $0 by $150k); unused losses carry forward. On sale, claimed depreciation is recaptured at up to 25%, and gains may owe capital-gains tax (a 1031 exchange can defer both). Figures are a year-1 estimate at your 24.0% rate — not tax advice; consult a CPA.
Schools (NCES district)
- District
- School City Of Mishawaka
- NCES district ID
- 1806840
- Math proficiency
- 23% ▼ -9.00%
- Reading proficiency
- 30% ▼ -7.00%
- Median HH income
- $39,290
- Composite
- 22.26/100
- National rank
- #8143
- State rank
- #260 of 301 in IN
Livability — Mishawaka
- Score
- 76/100
- State rank
- #53
- US rank
- #3586
Category grades
Schools grade is shown separately in the Schools card above.
Census & demographics
- Census place
- Mishawaka, IN
- County
- Saint Joseph County · 189,048 people
- City population
- 57,683
- Metro
- South Bend-Mishawaka, IN-MI
- Population (ZIP)
- 26,606
- Household income
- $56,865
- Rent vs Own
- Severe rent burden
- 1243.0
Population outlook (St. Joseph County) Hauer SSP2
- Today (2025)
- 273,186 people
- By 2030
- 273,594 · +0.1%
- By 2040
- 271,641 · -0.6%
- By 2050
- 269,187 · -1.5%
- By 2075
- 263,136 · -3.7%
- By 2100
- 245,659 · -10.1%
Race, ethnicity, and origin ACS 2023
- Neighborhood character
- Predominantly White (78%)
- Race & ethnicity
- White 78% Two or more races 8% Black 7% Hispanic / Latino 6% Asian 3%
- Hispanic origin (detail)
- Mexican 2%
- Common ancestry
- Romanian 6% Lithuanian 2% English 2%
- Foreign-born
- 8% · Canada, China, South Korea
- Languages at home
- 90% English-only · Spanish 4% Chinese 1% Other Indo-European 1%
Political lean MEDSL · St. Joseph
- 2024 margin
- Toss-up / Even · D 50.0% · R 48.5% · Other 1.5%
- 2008→2024 swing
- -15.6pp toward R · 2008: 17.1pp · 2024: 1.5pp
- All cycles
- 2024: D+1.5 2020: D+5.8 2016: D+0.2 2012: D+3.5 2008: D+17.1
Not yet ingested
- Civics
- —
Market trends
- HPI YoY
- ▼ -114.83%
- Current HPI
- 188.2811
- Rent YoY
- ▲ 5.20%
- Metro
- South Bend-Mishawaka, IN-MI
- State GDP YoY
- ▲ 2.90%
- F500 in state
- 18
Industry mix (Fortune 500 HQ in IN)
| Industry | F500 HQs | Revenue |
|---|---|---|
| Industrial Machinery | 2 | $37B |
|
||
| Healthcare | 1 | $177B |
|
||
| Pharmaceuticals | 1 | $45B |
|
||
| Metals / Steel | 1 | $18B |
|
||
| Agriculture | 1 | $17B |
|
||
| Packaging | 1 | $12B |
|
||
Price history
2 events — show timeline
- 2026-06-05 Pending — IRMLS
- 2026-06-03 Listed $212,000 IRMLS
Property tax history
+8.0%/yrLatest (2024): $1,358 · +2.3% YoY. Source: county tax records.
Cash-flow waterfall
monthlySold comps — $/sqft
last 12 mo · ≤1 miLoading sold comps…