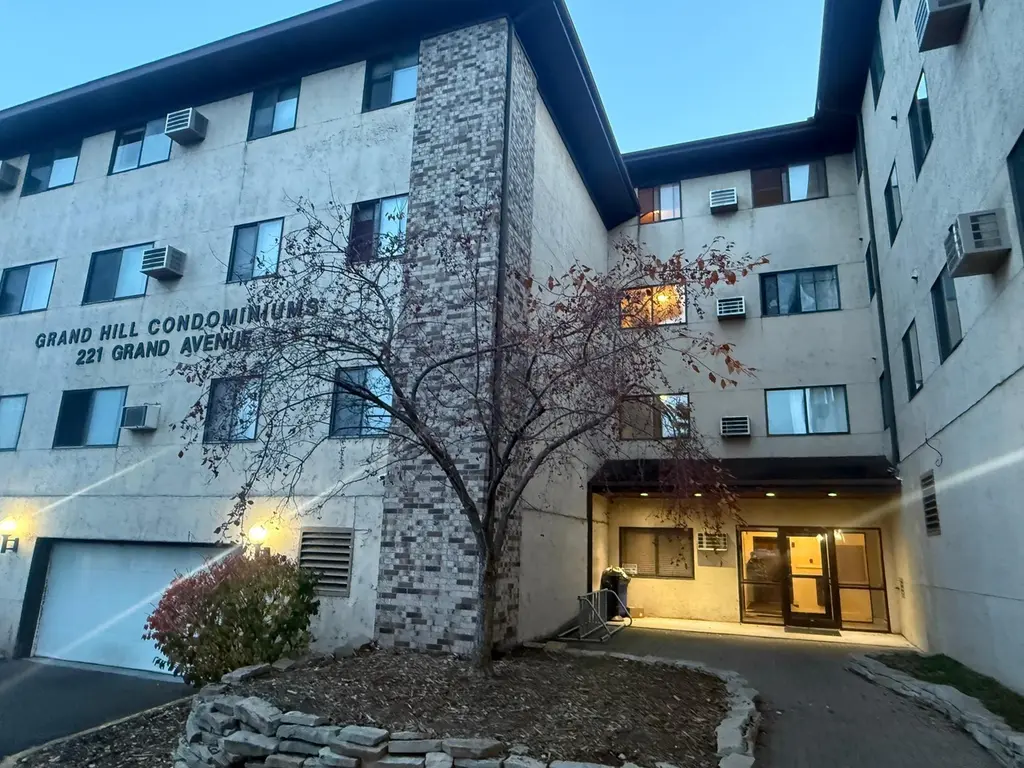
221 Grand Ave W #308
South St. Paul, MN 55075
$108,000C+
2 bd · 1.0 ba ·
910 sqft ·
Built 1986
· SingleFamily
· Active
· 222 DOM
Cashflow @ list (25.0% down · 7.5%)
Estimated rent
$1,657/mo
Mortgage (P&I)
−$566
Tax + insurance
−$169
HOA
−$400
Vac / Maint / Mgmt
−$348
Net cashflow
$174/mo
Annual
$2,086/yr
Cap rate
8.22%
Cash-on-cash
6.90%
DSCR
1.31
1% rule
1.53%
Cash to close
$30,240
Investor read
- This is a 2-bed/1.0-bath single-family listed at $108k.
- At list price, monthly cash flow is $174 ($2k/yr) — positive.
- The deal already cash-flows at list — no discount required.
- Meets the 1% rule at list price ($2k rent vs $108k).
- It's been on market 222 days — a 12% lower offer ($95k) is reasonable based on typical stale-listing flexibility.
- Recommended offer: $95k (12.0% below list) — sets the bar for market timing.
- Local home prices are declining (-3.0%/yr); year-one equity from $747 of loan paydown is wiped out by about $3k of value loss. Plan a longer hold.
- Location reads: area grade C — affects rentability + tenant quality, not the cash-flow math above.
- South St. Paul Public School District (suburban): math 23% / reading 34% proficiency, ranked #266 of 301 in MN (top 88%) — low school quality limits family demand, transient renter base, plan for 1-2y turnover.
- Zoned schools: Lincoln Center Elementary (math 33% / reading 41%, grade F, #636 of 857 statewide, top 76%, 666 students, 58% FRL); South St. Paul Middle School (math 12% / reading 30%, grade F, #231 of 258 statewide, top 89%, 658 students, 61% FRL) — zoned schools average 59% FRL vs 36% district-wide (23 pts higher); higher-poverty schools than district average — tighter screening recommended.
- Watch-outs: HOA is 24% of rent.
- Market conditions: 90 active listings in the ZIP; 16 comparable units currently listed for rent nearby; rentals at typical pace (median 15d on market — plan ~3-4 weeks tenant-placement turnaround); solid renter incomes; 2,134 units permitted in Dakota County in 2024 (898 in 5+ unit buildings).
- Dakota County population projected at +11% by 2050 — modest demand growth; plan on rents tracking national, not racing it.
- 8 sale attempts since 22y ago; this cycle's ask has dropped $17k (14%) from the opening price — seller is motivated, your offer sets the floor, not the list.
- Current owner paid $41k; list at $108k implies a 164% gain — meaningful room to come down on a strong offer.
- Cap rate 8.2% vs local median 4.2% in South St. Paul — top-decile yield for the area; either an underpriced asset or a hidden risk that comps aren't pricing in. Stress-test before assuming the spread holds.
Questions for listing agent
- It's been on market 222 days. Have you received any prior offers? Is the seller open to a 12% concession, seller financing, or rate buy-down credit?
- What does the HOA fee cover, when was the last increase, and are there any pending special assessments or reserve-fund shortfalls?
- Why hasn't it sold? Are there any deal-killer items the seller is aware of (foundation, flood, title, zoning, code violations)?
- Is there a deadline driving the sale (1031 exchange, divorce, estate, relocation)? That informs how much negotiation room exists.
- What's the average days-on-market for RENTAL listings here right now (not sales)? A rising rental-DOM trend means longer vacancies and softer asking-rent achievability than the comps imply.
- What's the recent tenant-quality profile in this submarket — average credit score on applications, eviction rate, late-payment / NSF rate, and stable-employment percentage? A property-management company in the area should have these aggregated.
- How much new for-sale + rental construction is in the pipeline within 1–3 miles? Heavy new supply typically softens prices + rents 12–24 months out; constrained supply supports both.
CashFlowRE · CFR-3JBNHQ8FYTX34T
· Data 54 min ago
cashflowre.app · 2026-05-29