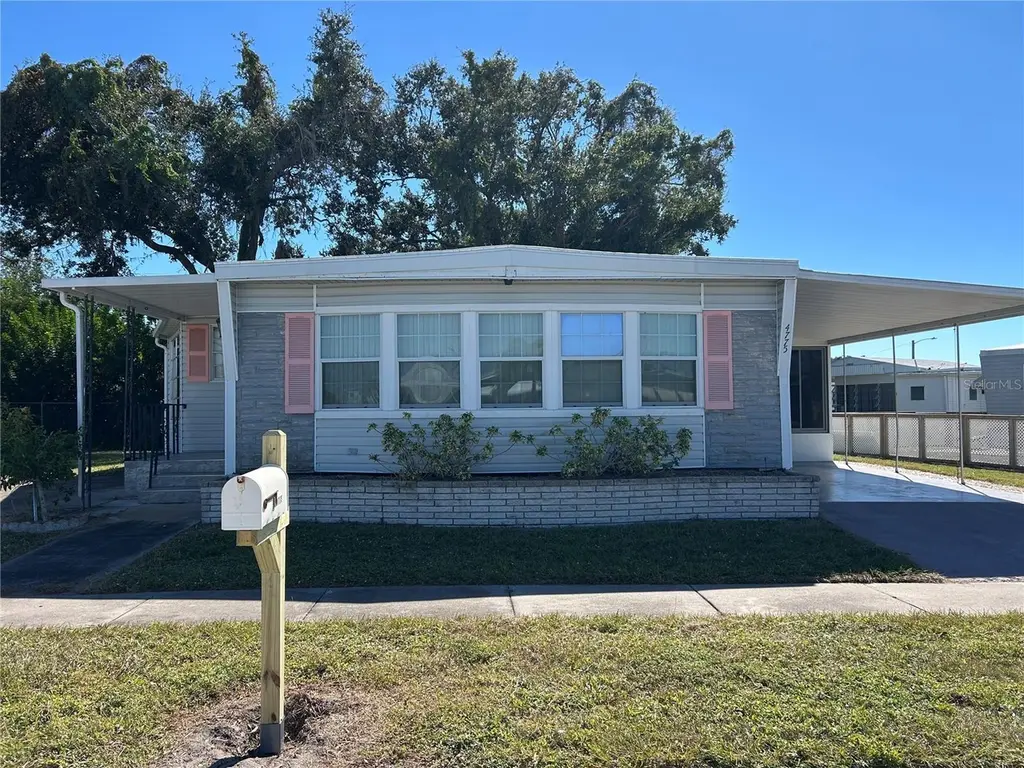
4775 Tri Par Dr
Desoto Acres, FL 34234
$198,900D
2 bd · 2.0 ba ·
1,108 sqft ·
Built 1969
· Manufactured
· Active
· 225 DOM
Cashflow @ list (25.0% down · 7.5%)
Estimated rent
$2,126/mo
Mortgage (P&I)
−$1,043
Tax + insurance
−$470
HOA
−$206
Vac / Maint / Mgmt
−$447
Net cashflow
$-39/mo
Annual
$-471/yr
Cap rate
6.06%
Cash-on-cash
-0.85%
DSCR
0.96
1% rule
1.07%
Cash to close
$55,692
Investor read
- This is a 2-bed/2.0-bath manufactured listed at $199k.
- At list price, monthly cash flow is $-39 ($-471/yr) — negative.
- To cash-flow at today's rent, offer at most $192k (3.5% below list).
- Meets the 1% rule at list price ($2k rent vs $199k).
- It's been on market 225 days — a 12% lower offer ($175k) is reasonable based on typical stale-listing flexibility.
- Recommended offer: $175k (12.0% below list) — sets the bar for market timing.
- Local home prices are declining (-3.0%/yr); year-one equity from $1k of loan paydown is wiped out by about $6k of value loss. Plan a longer hold.
- Location reads: area grade D — affects rentability + tenant quality, not the cash-flow math above.
- Sarasota (urban): math 63% / reading 63% proficiency, ranked #7 of 73 in FL (top 10%) — acceptable for families but not a draw, mixed tenant base, ~2y average lease.
- Market conditions: Rents falling (-3.1%/yr); 268 active listings in the ZIP; 6 comparable units currently listed for rent nearby; rentals leasing fast (median 2d on market — plan ~1-2 weeks tenant-placement turnaround); 7,466 units permitted in Sarasota County in 2024 (2,138 in 5+ unit buildings).
- Sarasota County population projected at +20% by 2050 — long-run rental-demand tailwind backs the buy-and-hold thesis.
- 6 sale attempts since 18y ago with the ask held roughly flat each time — persistent listings suggest the price (not the market) is what's stuck; bring a comps-based counter.
- Current owner paid $122k; list at $199k implies a 62% gain — meaningful room to come down on a strong offer.
- Climate carrying-cost: severe wind risk, 99% chance of damaging wind over 30y; extreme-heat days projected 7→29/yr by 2055 (HVAC capex compounding) — expect insurance premiums to compound above CPI over the hold.
- Cap rate 6.1% vs local median 4.0% in Desoto Acres — top-decile yield for the area; either an underpriced asset or a hidden risk that comps aren't pricing in. Stress-test before assuming the spread holds.
- This rent runs 45% of the median local income ($57k/yr) — at the standard rent-burdened threshold; future hikes will face affordability resistance.
Questions for listing agent
- What do current leases actually rent for vs. the listed asking? Can we see a recent rent roll and the last 12 months of T-12 income?
- It's been on market 225 days. Have you received any prior offers? Is the seller open to a 12% concession, seller financing, or rate buy-down credit?
- Built in 1969 — when were the roof, HVAC, electrical panel, plumbing, and water heater last replaced?
- What does the HOA fee cover, when was the last increase, and are there any pending special assessments or reserve-fund shortfalls?
- Why hasn't it sold? Are there any deal-killer items the seller is aware of (foundation, flood, title, zoning, code violations)?
- Is there a deadline driving the sale (1031 exchange, divorce, estate, relocation)? That informs how much negotiation room exists.
- The area grade is low — what's the realistic commute time and amenity access for the typical tenant pool here? Any planned neighborhood developments (good or bad) we should know about?
- What's the average days-on-market for RENTAL listings here right now (not sales)? A rising rental-DOM trend means longer vacancies and softer asking-rent achievability than the comps imply.
CashFlowRE · CFR-3MTSAZ2Q04KC8S
· Data 2 days ago
cashflowre.app · 2026-05-29