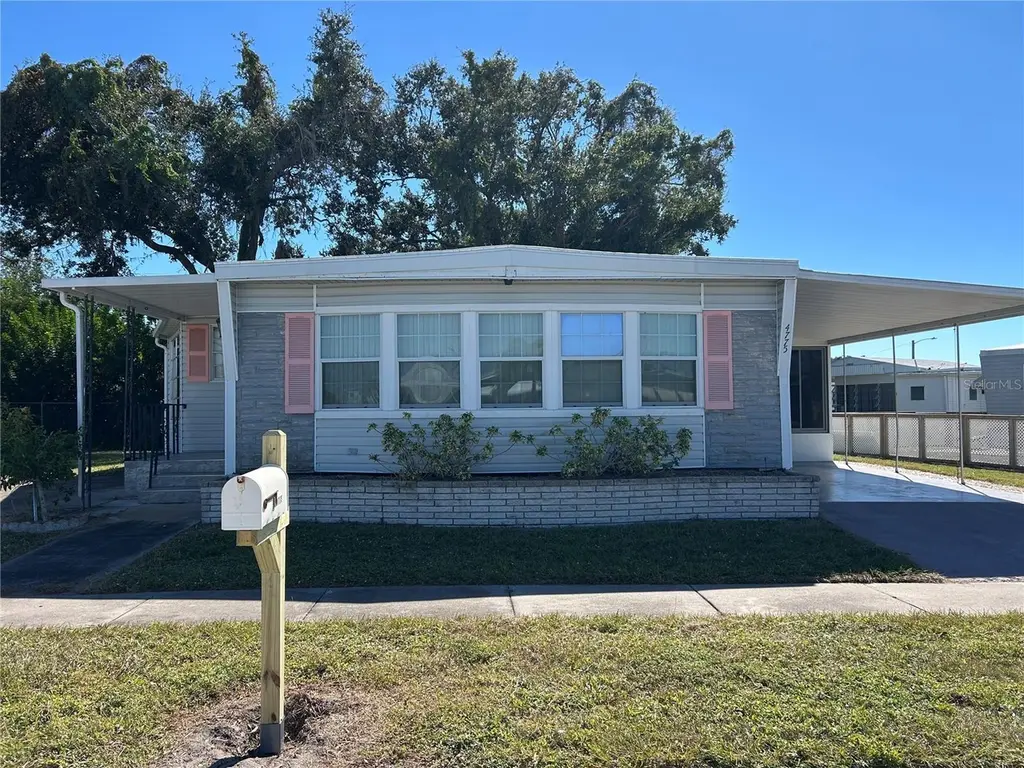
4775 Tri Par Dr · Desoto Acres, FL
Flood risk 1/10 · Minimal
- FEMA flood zone
- X (unshaded)
- Chance of flooding over 30 yrs
- 0.0%
- Est. flood insurance / yr
- $507 – $1,088
Fire risk 1/10 · Minimal
- Est. fire insurance / yr
- $947 – $1,759
Heat risk 10/10 · Severe
- Hot days now (above 106°F)
- 7 days/yr
- Hot days in 30 yrs
- 29 days/yr
Wind risk 10/10 · Severe
- Chance of severe wind over 30 yrs
- 99.0%
Air-quality risk 2/10 · Minimal
- Unhealthy air days now
- 1 days/yr
- Unhealthy air days in 30 yrs
- 1 days/yr
Risk factors via First Street. Map © Google.
Why this score? — see what drove the D grade
The composite is a weighted blend of 9 inputs, each scored 0–100. Each bar is that input's sub-score; the figure is the points it added to the 100-point composite (weight × sub-score).
- Cash flow +12.2/30.0
- ARV discount +7.5/15.0
- 1% rule +5.7/10.0
- Schools +5.4/10.0
- DSCR +3.6/10.0
- Livability +2.5/5.0
- Condition / age +2.5/5.0
- Rent growth +1.7/5.0
- Appreciation +0.0/10.0
$198,900
🖨 Deal sheet 📄 Offer letter ✓ Due diligence
Listing remarks MLS
Checkout this handsome home ready for new owneers in popular Tri Par Estates! This property offers 1.5 lots - Unusually large lot. Offering 1100 square feet of living space, 2 bedroom, 2 bathroom, furniture included! Updates include 2025 new roof on the MH, some new flooring & ceiling updates in Living Rm, Dining Rm, Kitchen & Master Bedroom. Also includes 9 X 23 enclosed porch, 2nd parking pad, "golf cart is included" has not been run for 2 years+-. Large shed includes the W & D. This property is out of the flood zone code "X". Tri-Par Estates is a 55+ community in which you own your home and the land. A park fee of $2,472.00 based on 1.5 lots. Tri Par dues are part of the property taxes paid once a year, includes Frontier internet, cable also trash. There is a large pool, hot tub, mini golf, laundry facilities, fitness room, clubhouse, and many activities to enjoy. Just minutes to the airport and many other like necessities nearby like hospitals, shopping, restaurants and more. Please do not disturb resident. Airplanes & jets do fly over Tri Par Estates. Tri Par is a state park & recreation development.
Key facts
- 2nd parking pad
- Hot tub
- Large pool
Tags
Neighborhood map
What this means for you Summary
Snapshot
- This is a 2-bed/2.0-bath manufactured listed at $199k.
Deal economics
- At list price, monthly cash flow is $-39 ($-471/yr) — negative.
- To cash-flow at today's rent, offer at most $192k (3.5% below list).
- Meets the 1% rule at list price ($2k rent vs $199k).
- Recommended offer: $175k (12.0% below list) — sets the bar for market timing.
- Cap rate 6.1% vs local median 4.0% in Desoto Acres — top-decile yield for the area; either an underpriced asset or a hidden risk that comps aren't pricing in. Stress-test before assuming the spread holds.
Location & tenants
- Location reads: area grade D — affects rentability + tenant quality, not the cash-flow math above.
- Sarasota (urban): math 63% / reading 63% proficiency, ranked #7 of 73 in FL (top 10%) — acceptable for families but not a draw, mixed tenant base, ~2y average lease.
- Market conditions: Rents falling (-3.1%/yr); 268 active listings in the ZIP; 6 comparable units currently listed for rent nearby; rentals leasing fast (median 2d on market — plan ~1-2 weeks tenant-placement turnaround); 7,466 units permitted in Sarasota County in 2024 (2,138 in 5+ unit buildings).
- This rent runs 45% of the median local income ($57k/yr) — at the standard rent-burdened threshold; future hikes will face affordability resistance.
Forward outlook
- Local home prices are declining (-3.0%/yr); year-one equity from $1k of loan paydown is wiped out by about $6k of value loss. Plan a longer hold.
- Sarasota County population projected at +20% by 2050 — long-run rental-demand tailwind backs the buy-and-hold thesis.
Negotiation context
- It's been on market 225 days — a 12% lower offer ($175k) is reasonable based on typical stale-listing flexibility.
- 6 sale attempts since 18y ago with the ask held roughly flat each time — persistent listings suggest the price (not the market) is what's stuck; bring a comps-based counter.
- Current owner paid $122k; list at $199k implies a 62% gain — meaningful room to come down on a strong offer.
Risks & watch-outs
- Climate carrying-cost: severe wind risk, 99% chance of damaging wind over 30y; extreme-heat days projected 7→29/yr by 2055 (HVAC capex compounding) — expect insurance premiums to compound above CPI over the hold.
Questions for the listing agent
- What do current leases actually rent for vs. the listed asking? Can we see a recent rent roll and the last 12 months of T-12 income?
- It's been on market 225 days. Have you received any prior offers? Is the seller open to a 12% concession, seller financing, or rate buy-down credit?
- Built in 1969 — when were the roof, HVAC, electrical panel, plumbing, and water heater last replaced?
- What does the HOA fee cover, when was the last increase, and are there any pending special assessments or reserve-fund shortfalls?
- Why hasn't it sold? Are there any deal-killer items the seller is aware of (foundation, flood, title, zoning, code violations)?
- Is there a deadline driving the sale (1031 exchange, divorce, estate, relocation)? That informs how much negotiation room exists.
- The area grade is low — what's the realistic commute time and amenity access for the typical tenant pool here? Any planned neighborhood developments (good or bad) we should know about?
- What's the average days-on-market for RENTAL listings here right now (not sales)? A rising rental-DOM trend means longer vacancies and softer asking-rent achievability than the comps imply.
- What's the recent tenant-quality profile in this submarket — average credit score on applications, eviction rate, late-payment / NSF rate, and stable-employment percentage? A property-management company in the area should have these aggregated.
- How much new for-sale + rental construction is in the pipeline within 1–3 miles? Heavy new supply typically softens prices + rents 12–24 months out; constrained supply supports both.
Investment metrics
- 1% rule
- 1.07% ✓
- Cap rate
- 6.06%
- Cash-on-cash
- -0.85%
- DSCR
- 0.96
- GRM
- 7.8
CMA / ARV
No comps found within radius.
Projected returns pro-forma
-3.0% appreciation · 0.0% rent growth · sell at horizon
- IRR
- -21.9%
- Equity multiple
- 0.27×
- Total profit
- $-40,719
- Equity at exit
- $29,657
- IRR
- -29.1%
- Equity multiple
- -0.11×
- Total profit
- $-61,769
- Equity at exit
- $17,197
Cash invested: $55,692 (down + closing). Projections, not guarantees.
Landlord ↔ Tenant lean methodology
- Overall (STATE)
- 87 Strongly Landlord-Friendly
- State Florida
- 87 Strongly Landlord-Friendly · R+3
- County
- — inherits STATE
- City
- — inherits STATE
ZIP-level market 34234
- Rents YoY
- -3.1%
- Active inventory
- 268
- Price-to-rent
- 7.8×
Monthly cashflow live
- Estimated rent
- $2,126 high interval (Pro) →
- Mortgage (P&I)
- −$1,043
- Tax from tax record
- −$387 /mo · $4,645/yr
- Insurance
- −$83
- HOA
- −$206
- Vacancy / Maint / Mgmt
- −$447
- Net cashflow
- $-39
Break-even live
UW: 25.0% down · 7.5% · 30yr · 1.5% tax · 5.0% vac · 8.0% maint · 8.0% mgmt
Financing live
Cash to close
- Down payment
- $49,725
- Closing costs
- $5,967
- Reserves months
- —
- Total cash needed
- —
Loan-product check · same deal, 3 products live
Conventional
25% down · 7.5% · 30yr
- Down + closing
- —
- Monthly P&I
- —
- Monthly cashflow
- —
- DSCR
- —
- Eligible?
- —
Personal DTI + credit; lowest rate.
DSCR
20% down · 8.5% · 30yr
- Down + closing
- —
- Monthly P&I
- —
- Monthly cashflow
- —
- DSCR
- —
- Eligible?
- —
No personal income docs; deal must DSCR.
Hard money
10% down · 12.0% · 12mo
- Down + closing
- —
- Monthly P&I
- —
- Monthly cashflow
- —
- DSCR
- —
- Eligible?
- —
Short-term bridge; refi at stabilization.
Rent comps 6 comps
| Address | Beds | Baths | Sqft | Rent | $/sqft | DOM | Units | Dist |
|---|---|---|---|---|---|---|---|---|
| 2800 Telluride Loop Sarasota, FL | 1.0–3.0 | 1.0–2.0 | 1060 | $2,270 | $2.14 | 1d | 20 | 1.08mi |
| 2351 University Pkwy Sarasota, FL | 1.0–3.0 | 1.0–2.0 | 1046 | $2,480 | $2.37 | 1d | 24 | 1.15mi |
| 3112 Oriole Dr Sarasota, FL | 2.0 | 2.0 | 1397 | $1,995 | $1.43 | 15d | 1 | 1.29mi |
| 2575 University Pkwy Sarasota, FL | 1.0–3.0 | 1.0–2.0 | 1026 | $2,318 | $2.26 | 1d | 25 | 1.35mi |
| 8310 Bella Grove Cir Sarasota, FL | 1.0–2.0 | 1.0–2.0 | 897 | $1,891 | $2.11 | 1d | 13 | 1.44mi |
| 8377 38th Street Cir E Sarasota, FL | 1.0 | 1.0 | 900 | $1,994 | $2.22 | 15d | 2 | 1.47mi |
HOA detail
- Monthly dues
- $206 · $2,472/yr
- Likely covers
- trashinternetcablepool
Listing history 29 events
-
2026-06-18days on market $198,900 Active 225 DOM
-
2026-06-17days on market $198,900 Active 224 DOM
-
2026-06-16days on market $198,900 Active 223 DOM
-
2026-06-15days on market $198,900 Active 222 DOM
-
2026-06-13days on market $198,900 Active 220 DOM
-
2026-06-13days on market $198,900 Active 219 DOM
-
2026-06-10days on market $198,900 Active 217 DOM
-
2026-06-09days on market $198,900 Active 216 DOM
-
2026-06-08days on market $198,900 Active 214 DOM
-
2026-06-05days on market $198,900 Active 211 DOM
-
2026-06-03days on market $198,900 Active 210 DOM
-
2026-06-02days on market $198,900 Active 209 DOM
-
2026-06-01days on market $198,900 Active 208 DOM
-
2026-05-31days on market $198,900 Active 207 DOM
-
2025-12-27price $198,900 1170-char remark
Show marketing remark (1170 chars)
Checkout this handsome home ready for new owneers in popular Tri Par Estates! This property offers 1.5 lots - Unusually large lot. Offering 1100 square feet of living space, 2 bedroom, 2 bathroom, furniture included! Updates include 2025 new roof on the MH, some new flooring & ceiling updates in Living Rm, Dining Rm, Kitchen & Master Bedroom. Also includes 9 X 23 enclosed porch, 2nd parking pad, "golf cart is included" has not been run for 2 years+-. Large shed includes the W & D. This property is out of the flood zone code "X". Tri-Par Estates is a 55+ community in which you own your home and the land. A park fee of $2,472.00 based on 1.5 lots. Tri Par dues are part of the property taxes paid once a year, includes Frontier internet, cable also trash. There is a large pool, hot tub, mini golf, laundry facilities, fitness room, clubhouse, and many activities to enjoy. Just minutes to the airport and many other like necessities nearby like hospitals, shopping, restaurants and more. Please do not disturb resident. Airplanes & jets do fly over Tri Par Estates. Tri Par is a state park & recreation development.
-
2025-11-05$208,000 Active 1170-char remark
Show marketing remark (1170 chars)
Checkout this handsome home ready for new owneers in popular Tri Par Estates! This property offers 1.5 lots - Unusually large lot. Offering 1100 square feet of living space, 2 bedroom, 2 bathroom, furniture included! Updates include 2025 new roof on the MH, some new flooring & ceiling updates in Living Rm, Dining Rm, Kitchen & Master Bedroom. Also includes 9 X 23 enclosed porch, 2nd parking pad, "golf cart is included" has not been run for 2 years+-. Large shed includes the W & D. This property is out of the flood zone code "X". Tri-Par Estates is a 55+ community in which you own your home and the land. A park fee of $2,472.00 based on 1.5 lots. Tri Par dues are part of the property taxes paid once a year, includes Frontier internet, cable also trash. There is a large pool, hot tub, mini golf, laundry facilities, fitness room, clubhouse, and many activities to enjoy. Just minutes to the airport and many other like necessities nearby like hospitals, shopping, restaurants and more. Please do not disturb resident. Airplanes & jets do fly over Tri Par Estates. Tri Par is a state park & recreation development.
-
2025-03-13historical
-
2024-09-13$214,900 Active
-
2017-04-24soldstatus $122,500
-
2017-04-18soldstatus $122,500 Sold
-
2017-03-31status Pending
-
2017-03-03$129,900 Active
-
2012-02-23soldstatus $53,000
-
2011-09-29$64,900
-
2011-02-17$84,900
-
2008-10-30soldstatus $85,000
-
2008-07-31$89,900
-
1987-04-01soldstatus $55,000
-
1975-08-01soldstatus $25,500
ⓘ Source: listings_history table (triggers on properties + properties_extension) + one-shot
backfill from property_details.listing_events for pre-trigger history.
Tax reassessment forecast FL · Resets to sale price
- Current annual tax
- $4,645 · $387/mo
- Projected year-2 tax
- $4,645 · $387/mo
- Expected delta
- $0/yr ($0/mo · 0.0%)
ⓘ Screening estimate from a state-policy table — verify with the county assessor before closing.
Climate risk First Street
- Flood 1/10 Low FEMA zone X (unshaded) · 0% chance over 30 yrs
- Wildfire 1/10 Low
- Heat 10/10 Extreme 7 d/yr ≥106°F today · 29 d/yr by 30 yrs out
- Wind 10/10 Extreme 99% chance of damaging wind over 30 yrs
- Air quality 2/10 Low 1 unhealthy d/yr today · 1 by 30 yrs out
Nearby sold comps map
Loading sold comps map…
Walkable amenities ~0.75 mi
Loading nearby amenities…
Taxation est. · year 1
- Rental income
- $25,515
- − Mortgage interest
- −$11,141
- − Property taxes
- −$4,645
- − Insurance
- −$994
- − Repairs & maintenance
- −$2,041
- − Management
- −$2,041
- − HOA
- −$2,472
- − Depreciation
- −$5,786
- Taxable loss
- −$3,607
- Est. tax savings @ 24.0%
- +$866
- After-tax cash flow
- $394/yr
For passive investors: Depreciation is non-cash, so a rental often shows a tax loss while cash-flowing — sheltering income. Rental losses are passive: they offset passive income freely, and up to $25,000/yr can offset ordinary (W-2) income if you actively participate and your MAGI is under $100k (phasing out to $0 by $150k); unused losses carry forward. On sale, claimed depreciation is recaptured at up to 25%, and gains may owe capital-gains tax (a 1031 exchange can defer both). Figures are a year-1 estimate at your 24.0% rate — not tax advice; consult a CPA.
Schools (NCES district)
- District
- Sarasota
- NCES district ID
- 1201680
- Math proficiency
- 63% ▼ -8.00%
- Reading proficiency
- 63% ▼ -3.00%
- Median HH income
- $51,167
- Composite
- 53.68/100
- National rank
- #1428
- State rank
- #7 of 73 in FL
Livability — Desoto Acres
No livability data for this city. (Only ~50 U.S. cities are tracked.)
Census & demographics
- County
- Sarasota County · 448,376 people
- Metro
- North Port-Sarasota-Bradenton, FL
- Population (ZIP)
- 22,986
- Household income
- $57,288
- Rent vs Own
- Severe rent burden
- 1306.0
Population outlook (Sarasota County) Hauer SSP2
- Today (2025)
- 452,380 people
- By 2030
- 474,175 · +4.8%
- By 2040
- 511,577 · +13.1%
- By 2050
- 541,467 · +19.7%
- By 2075
- 604,947 · +33.7%
- By 2100
- 621,965 · +37.5%
Race, ethnicity, and origin ACS 2023
- Neighborhood character
- Diverse neighborhood (Simpson 0.68)
- Race & ethnicity
- White 44% Black 31% Hispanic / Latino 20% Two or more races 14% Asian 1%
- Hispanic origin (detail)
- Mexican 8% Puerto Rican 1% Cuban 6% Dominican 1%
- Common ancestry
- Lithuanian 4% Hispanic 2% Romanian 1%
- Foreign-born
- 17% · Canada, Jamaica, China
- Languages at home
- 81% English-only · Spanish 17% French/Haitian/Cajun 1%
Political lean MEDSL · Sarasota
- 2024 margin
- R (+18.2) · D 40.5% · R 58.7%
- 2008→2024 swing
- -18.1pp toward R · 2008: -0.1pp · 2024: -18.2pp
- All cycles
- 2024: R+18.2 2020: R+10.4 2016: R+11.6 2012: R+7.4 2008: R+0.1
Not yet ingested
- Civics
- —
Market trends
- HPI YoY
- ▼ -229.06%
- Current HPI
- 305.6629
- Rent YoY
- ▼ -3.15%
- Metro
- North Port-Sarasota-Bradenton, FL
- State GDP YoY
- ▲ 3.28%
- F500 in state
- 36
Industry mix (Fortune 500 HQ in FL)
| Industry | F500 HQs | Revenue |
|---|---|---|
| Industrial Technology | 2 | $29B |
|
||
| Insurance | 2 | $17B |
|
||
| Retail | 1 | $60B |
|
||
| Technology Distribution | 1 | $58B |
|
||
| Homebuilding | 1 | $35B |
|
||
| Technology Manufacturing | 1 | $35B |
|
||
Price history
+680.0% since first listed15 events — show timeline
- 2025-12-27 Price Changed $198,900 Stellar MLS as Distributed by MLS Grid
- 2025-11-05 Listed $208,000 Stellar MLS as Distributed by MLS Grid
- 2025-03-13 Listing Removed — Stellar MLS as Distributed by MLS Grid
- 2024-09-13 Listed $214,900 Stellar MLS as Distributed by MLS Grid
- 2017-04-24 Sold (Public Records) $122,500 Public Records
- 2017-04-18 Sold (MLS) $122,500 Stellar MLS as Distributed by MLS Grid
- 2017-03-31 Pending — Stellar MLS as Distributed by MLS Grid
- 2017-03-03 Listed $129,900 Stellar MLS as Distributed by MLS Grid
- 2012-02-23 Sold (MLS) $53,000 Stellar MLS as Distributed by MLS Grid
- 2011-09-29 Listed $64,900 Stellar MLS as Distributed by MLS Grid
- 2011-02-17 Listed $84,900 Stellar MLS as Distributed by MLS Grid
- 2008-10-30 Sold (MLS) $85,000 Stellar MLS as Distributed by MLS Grid
- 2008-07-31 Listed $89,900 Stellar MLS as Distributed by MLS Grid
- 1987-04-01 Sold (Public Records) $55,000 Public Records
- 1975-08-01 Sold (Public Records) $25,500 Public Records
Property tax history
+6.0%/yrLatest (2025): $4,645 · +5.0% YoY. Source: county tax records.
Cash-flow waterfall
monthlySold comps — $/sqft
last 12 mo · ≤1 miLoading sold comps…