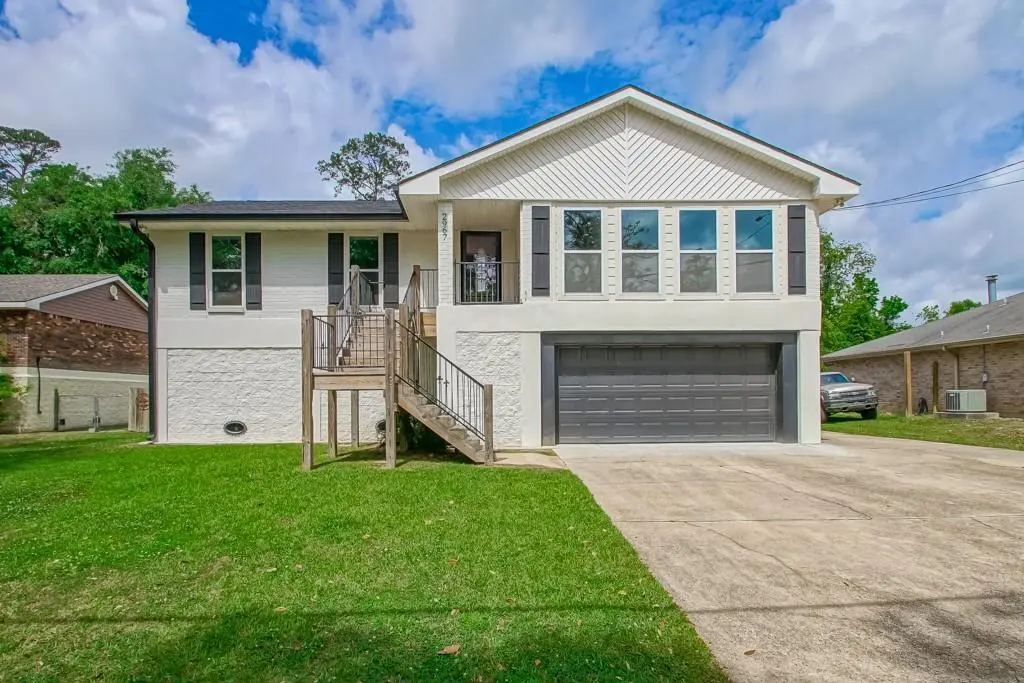
2967 Palm Dr
Slidell, LA 70458
$254,900B-
3 bd · 2.0 ba ·
2,312 sqft ·
Built 1976
· SingleFamily
· Active
· 68 DOM
Cashflow @ list (25.0% down · 7.5%)
Estimated rent
$2,819/mo
Mortgage (P&I)
−$1,337
Tax + insurance
−$384
HOA
−$0
Vac / Maint / Mgmt
−$592
Net cashflow
$507/mo
Annual
$6,078/yr
Cap rate
8.68%
Cash-on-cash
8.52%
DSCR
1.38
1% rule
1.11%
Cash to close
$71,372
Investor read
- This is a 3-bed/2.0-bath single-family listed at $255k.
- At list price, monthly cash flow is $507 ($6k/yr) — positive.
- The deal already cash-flows at list — no discount required.
- Meets the 1% rule at list price ($3k rent vs $255k).
- It's been on market 68 days — a 6% lower offer ($240k) is reasonable based on typical stale-listing flexibility.
- Recommended offer: $240k (6.0% below list) — sets the bar for market timing.
- Local home prices are declining (-3.0%/yr); year-one equity from $2k of loan paydown is wiped out by about $8k of value loss. Plan a longer hold.
- Location reads 70/100 on livability (#57 in LA) — a middle-class / working-renter tenant base. Strengths: cost of living A+, housing A+, health & safety A+; Watch: amenities F, commute F.
- St. Tammany Parish (suburban): math 43% / reading 55% proficiency, ranked #11 of 98 in LA (top 11%) — families likely to look elsewhere, expect single-tenant / working-renter base with shorter leases.
- Zoned schools: Glynn H. Brock Elementary School (math 32% / reading 42%, grade F, #251 of 646 statewide, top 41%, 320 students, 79% FRL); St. Tammany Junior High School (math 19% / reading 41%, grade F, #114 of 218 statewide, top 53%, 793 students, 68% FRL); Salmen High School (math 15% / reading 27%, grade F, #179 of 265 statewide, top 68%, 1,216 students, 62% FRL) — zoned schools average 70% FRL vs 40% district-wide (30 pts higher); higher-poverty schools than district average — tighter screening recommended.
- Zoned-school proficiency averages 29% at this address vs 49% district-wide (-20 pts) — the specific schools serving this property underperform the St. Tammany Parish average; the district grade overstates school quality for this exact location.
- Market conditions: Rents rising (+1.5%/yr); 489 active listings in the ZIP; 3 comparable units currently listed for rent nearby; rentals at typical pace (median 26d on market — plan ~3-4 weeks tenant-placement turnaround); 1,064 units permitted in St. Tammany Parish in 2024 (0 in 5+ unit buildings).
- St. Tammany County population projected at +27% by 2050 — long-run rental-demand tailwind backs the buy-and-hold thesis.
- 6 sale attempts since 22y ago with the ask held roughly flat each time — persistent listings suggest the price (not the market) is what's stuck; bring a comps-based counter.
- Current owner paid $93k; list at $255k implies a 173% gain — meaningful room to come down on a strong offer.
- Cap rate 8.7% vs local median 5.9% in Slidell — top-decile yield for the area; either an underpriced asset or a hidden risk that comps aren't pricing in. Stress-test before assuming the spread holds.
- At $2,819/mo this rent would consume 46% of the median local household income ($73k/yr) (locally 1331% of renters already pay >50% of income on rent) — very limited rent-growth headroom before tenants either downsize or default.
Questions for listing agent
- It's been on market 68 days. Have you received any prior offers? Is the seller open to a 6% concession, seller financing, or rate buy-down credit?
- Built in 1976 — when were the roof, HVAC, electrical panel, plumbing, and water heater last replaced?
- Why hasn't it sold? Are there any deal-killer items the seller is aware of (foundation, flood, title, zoning, code violations)?
- Is there a deadline driving the sale (1031 exchange, divorce, estate, relocation)? That informs how much negotiation room exists.
- Schools are B-rated — typically a magnet for longer-tenancy family renters. What's the average tenant stay here, and is there a school-zone premium baked into asking?
- What's the average days-on-market for RENTAL listings here right now (not sales)? A rising rental-DOM trend means longer vacancies and softer asking-rent achievability than the comps imply.
- What's the recent tenant-quality profile in this submarket — average credit score on applications, eviction rate, late-payment / NSF rate, and stable-employment percentage? A property-management company in the area should have these aggregated.
- How much new for-sale + rental construction is in the pipeline within 1–3 miles? Heavy new supply typically softens prices + rents 12–24 months out; constrained supply supports both.
CashFlowRE · CFR-3MVY4NAREBMP7V
· Data 23 h ago
cashflowre.app · 2026-05-29